Dashboards

Grafana Cloud updates: explore metrics without PromQL, native OpenTelemetry log support, cool panels, and more

We are consistently releasing helpful updates and fun features in Grafana Cloud, our fully managed observability platform powered by the open source Grafana LGTM Stack (Loki for logs, Grafana for visualization, Tempo for traces, and Mimir for metrics). This month is no exception.

How to Build an Effective Network Monitoring Dashboard

Whether you're a small startup or a large enterprise, the health and performance of your network infrastructure are critical to your success. This is where network monitoring comes into play. Network monitoring involves the continuous observation and analysis of network traffic, devices, and performance metrics to ensure smooth operations, detect anomalies, and troubleshoot issues promptly.

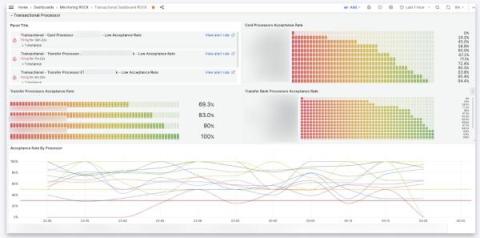
The Leading Data Dashboard Examples

As organizations produce a significant amount of data from varying sources, simple analytics tools can make it challenging and time-consuming to derive insights from this data. Data dashboards can assist with this. A data dashboard is a visual representation of data that offers an at-a-glance view of key performance indicators (KPIs), metrics, and other important information relevant to a particular business, organization, or process.

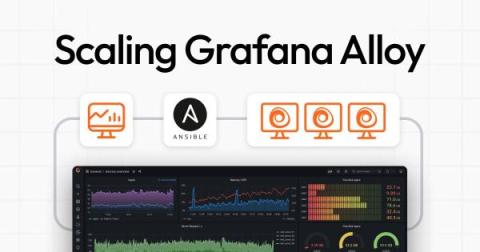
A guide to scaling Grafana Alloy deployments across multiple hosts

Last week we introduced Grafana Alloy, our distribution of the OpenTelemetry Collector with built-in Prometheus pipelines and support for metrics, logs, traces, and profiles. We’re excited to see the community embrace Alloy, and we want to help them use and scale it as easily as possible. Many developers that need to deploy and manage software across several hosts turn to Ansible for its ease of use and versatility.

Structure of Logs (Part 1) | Zero to Hero: Loki | Grafana

Have you just discovered Grafana Loki? Zero to Hero: Loki is a series of videos that aims to take you through the basics of ingesting, your logs into Grafana Loki an open-source log aggregation solution. In this episode, it's all about the structure of logs. In part 1 we cover what components make up a log entry. ☁️ Grafana Cloud is the easiest way to get started with Grafana dashboards, metrics, logs, and traces. Our forever-free tier includes access to 10k metrics, 50GB logs, 50GB traces and more. We also have plans for every use case.

GrafanaCON 2024 Keynote: Grafana 11, Loki 3.0, Alloy, Golden Grot Awards, and more | Grafana

During GrafanaCON 2024, we came back together in person for the first time since 2019. Grafana Labs CEO and Co-founder Raj Dutt announced the winners of the Golden Grot community dashboard awards, and members of our engineering team made some exciting announcements around our open source observability projects including Loki 3.0 and Alloy. And Torkel Ödegaard, the creator of Grafana, unveiled what’s new in Grafana 11, with some demos.

Why companies choose Grafana Cloud for their hosted observability platform

Three different businesses, one shared problem: SailPoint, Kushki, and Flexcity were all looking for a hosted solution to help them optimize their telemetry storage, gain more insights from their observability strategy, and keep costs manageable. But what they gained from migrating to Grafana Cloud and working with Grafana Labs was much more. “The engineering team is super sharp. They’re experts. This is the best of the best," said Omar Lopez, head of the observability team from SailPoint.