Dashboards

How to improve your observability strategy: Introducing the Observability Journey Maturity Model

While many segments of the IT market move quickly, the observability space seems to move at lightning speed. Fueled by open source innovation, observability toolsets and best practices constantly evolve. Sometimes, it can be tough to keep up — and even tougher to know where your own observability strategy stands. That’s the exact challenge we aim to address with our new Observability Journey Maturity Model.

Inside TeleTracking's journey to build a better observability platform with Grafana Cloud

Oren Lion, Director of Software Engineering, Productivity Engineering, and Tim Schruben, Vice President, Logistics Engineering, both work for TeleTracking, an integrated healthcare operations platform provider that is Expanding the Capacity to Care™ by helping health systems optimize access to care, streamline care delivery, and connect transitions of care.

Getting started with Application Observability for Java

Links: Description: Get started with instrumenting Java applications with Grafana Cloud to observe them, detect anomalies, and find root causes. In this video, Grafana Developer Advocate Leandro Melendez outlines how to quickly get started with Application Observability for Java based on these three easy steps: Download the Grafana instrumentation agent Instrument an application and send telemetry data to the Grafana Cloud OTLP Endpoint Observe the service in Application Observability.

How to manage Grafana instances within Kubernetes

If you’re using Grafana and Kubernetes, we’ve got exciting news — Grafana Labs will be maintaining and managing the Grafana Operator, the open source Kubernetes operator that helps you manage your Grafana instances within and outside of Kubernetes. This significant move not only elevates the Grafana Operator to an officially supported tool but also cements its place as a staple for managing Grafana as code, especially for users keen on adopting GitOps principles.

The Top 15 Splunk Dashboard Examples

The ability to extract meaningful insights from your wealth of organisational information is often the key differentiator between successful businesses and those struggling to stay competitive. Splunk, a renowned leader in the realm of data analytics and visualisation, has emerged as a powerful ally in this quest for actionable knowledge.

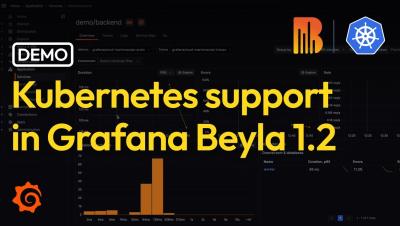
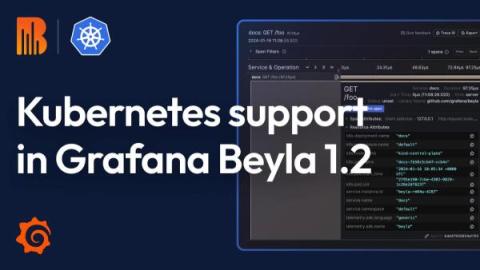
Grafana Beyla 1.2 release: eBPF auto-instrumentation with full Kubernetes support

We’re excited to announce that with the release of Grafana Beyla 1.2, Kubernetes support is now fully integrated. With this update, the Grafana Beyla configuration now “understands” Kubernetes semantics to provide a more fine-grained selection of services to instrument. Beyla users can decorate metrics and traces with the metadata of Kubernetes entities, such as pods and deployments, that run the automatically instrumented services.

Grafana 10.3 release: Canvas panel updates, multi-stack data sources, and more

Grafana 10.3 is here! Download Grafana 10.3 The latest version of Grafana brings advanced controls for anonymous access in your Grafana instance and new options for multi-stack data source configuration in Grafana Cloud. The release also enhances Grafana visualizations, with additions like pan and zoom for the canvas panel and updated tooltips for better data interpretation. Plus improvements in Grafana Alerting and log analysis capabilities provide more efficient monitoring and troubleshooting tools.