Dashboards

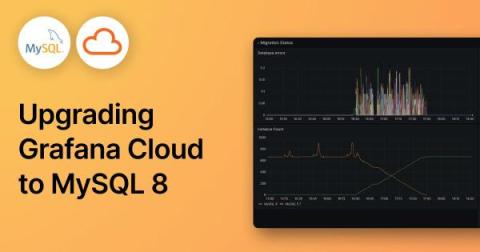
How we upgraded to MySQL 8 in Grafana Cloud

Starting around June this year, we upgraded our Grafana databases in Grafana Cloud from MySQL 5.7 to MySQL 8, due to MySQL 5.7 reaching end-of-life in October. This project involved tens of thousands of customer databases across dozens of MySQL database servers, multiple cloud providers, and many Kubernetes clusters.

Combining frontend and backend performance with John Hill (Grafana Office Hours #18)

In this episode of Grafana Office Hours, Developer Advocates Marie Cruz and Nicole van der Hoeven speak with John Hill, a Web UI Test Engineer and Grafana k6 champion, to talk about how the Grafana and k6 ecosystems can be used to ensure performance in mission-critical applications like NASA’s Open MCT.

Introducing the World's First Dashboard for GitOps Environments

Defining multiple environments in Argo CD and promoting an application between them is one of most popular questions for companies that adopt GitOps for their applications. While we have offered several guidelines in the past for organizing your GitOps environments, today we are taking it further by announcing a complete product that helps you visualize the full lifecycle of an application as it moves through different stages. Meet the new Codefresh GitOps Environment Dashboard!

Monitor your OpenAI usage with Grafana Cloud

In the ever-changing field of artificial intelligence, OpenAI is consistently seen as a leader in innovation. Its AI models, starting with GPT-3 and now with GPT-4, are already used extensively in software development and content creation, and they’re expected to usher in entire sets of new systems in the future.

What is Observability? Grafana for Beginners Ep. 1

When you are getting started with observability, the jargon and concepts used to explain observability may go straight over your head. Let’s take out the complexity and talk about observability in the simplest terms possible. Join Lisa Jung, a senior developer advocate at Grafana, to get your learning on with the Grafana for Beginners series. You will learn about concepts such as observability and DevOps and how Grafana can be used to observe your system as a part of your DevOps practice.

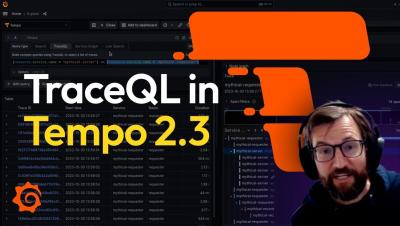
Grafana Tempo 2.3 release: faster trace queries, TraceQL upgrades

Grafana Tempo 2.3 has been unleashed upon the world, bringing with it the latest iteration of the vParquet backend! Tempo 2.3 has a little bit of everything, but the headline item here is vParquet3 and new features that improve search speeds. Watch the video above for all the details, or continue reading to get a quick overview of the latest updates in Tempo. If you’re looking for something more in-depth, don’t hesitate to jump into the changelog or our Grafana Tempo 2.3 release notes.

How to configure OpenTelemetry .NET Automatic Instrumentation with Grafana Cloud

For those who have limited experience with OpenTelemetry, it can be intimidating to instrument.NET applications. But the OpenTelemetry community created a welcome shortcut with the first stable release of.NET Automatic Instrumentation. It simplifies the process of collecting metrics, logs, and traces from your.NET applications, without applying any changes to the source code or adding any dependencies to the OSS project.

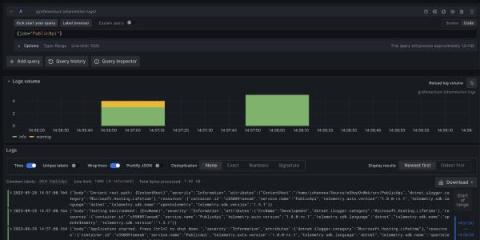
Create a logs app plugin with Grafana Scenes and Grafana Loki

Grafana’s plugin tools help developers extend Grafana’s core functionality and create plugins faster, with a modern build setup and zero configuration. Grafana Scenes, meanwhile, is a new front-end library, introduced with Grafana 10, that enables developers to create dashboard-like experiences — such as querying and transformations, dynamic panel rendering, and time ranges — directly within Grafana application plugins.