Dashboards

Kubernetes cost optimization: tips for a more efficient operation

Kubernetes offers unparalleled flexibility and scalability for containerized orchestration. However, this dynamism can also lead to unexpected costs if you don’t efficiently manage your corresponding cloud resources. In this blog, we’ll outline a series of best practices for Kubernetes cost optimization that will help you keep your infrastructure running smoothly while staying within your budget.

New in Grafana k6: The latest OSS features in v0.47.0 and more efficient performance testing in Grafana Cloud k6

Grafana k6 v0.47.0 has been released, featuring gRPC’s binary metadata support, new authentication methods, and tons of other improvements for Grafana k6 OSS. Here’s a quick overview of the latest features in Grafana k6 v0.47.0, as well as some other exciting updates related to Grafana Cloud k6 and the k6 community.

Behold a brand New Incident Dashboard!

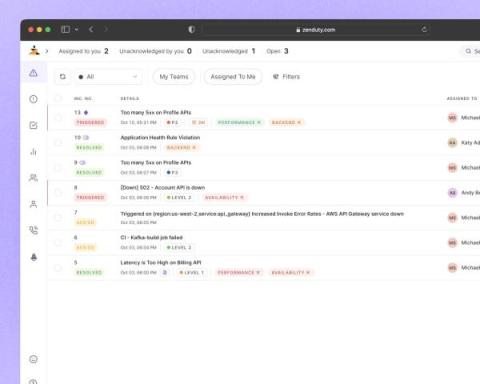
The incidents page, the most visited page on Zenduty, has an all-new look and feel! It's been completely redesigned from the ground up to be faster, easier to use, and more visually appealing. The Incidents list now dedicates more space for important information, such as the title, date, priority, and more. The UI is also more polished, shaving off whitespace where unnecessary. The avatars have been redesigned with more pastel shades, resulting in an overall design far more soothing to the eye.

How to easily retrieve values from a range in Grafana using a stat panel

Grafana is an open source visualization and monitoring solution for correlating and analyzing data from various sources. From time series graphs to heatmaps to 3D charts, it gives you lots of ways to untangle complex datasets. And while that’s incredibly powerful for observability, sometimes you’re looking for something fairly straightforward.

Reproducing and testing distributed system failures with xk6-disruptor

Distributed systems, such as modern microservices-based applications, are highly scalable, but also highly complex. Dependencies and unexpected interactions between services are a common cause of incidents, and these incidents are also notoriously hard to test for. xk6-disruptor — an extension that adds fault injection capabilities to Grafana k6, the open source reliability and load testing tool — can help overcome these challenges.

Grafana and Graphite Best Practices

Efficient monitoring and visualization of performance metrics are paramount for ensuring seamless user experiences and reliable system operations. Grafana and Graphite, two powerful open-source tools, form an unbeatable combination when it comes to monitoring and analyzing time-series data. Grafana provides a robust and flexible platform for visualizing data, while Graphite acts as a scalable and efficient backend for storing and retrieving metric data.

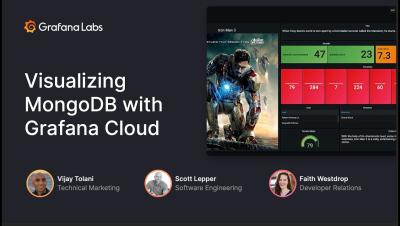
Visualizing MongoDB with Grafana Cloud

Learn to connect your MongoDB data and other data sources to a single dashboard to provide impactful insights into your business and improve visibility across teams. Vijay Tolani will demonstrate how to translate and transform your existing application and business metrics into flexible and versatile charts within dashboards using a wide array of visualizations, such as panels, bar gauges, geomaps, and more. Also query and alert on MongoDB and MongoDB Atlas data in real time without having to migrate or ingest it.