Dashboards
Preview: Cloud 66 New Dashboard to Streamline Application Deployment and Management
If you're a developer looking for an easier way to manage your Rails, JAMstack, or containerized applications, you'll be pleased to know that our team has worked hard to launch a new dashboard that simplifies the process. The new dashboard will be released to general availability next week. Here is a quick preview, let us know your thoughts.
Observability for business decision making: bridging the gap between IT and the business
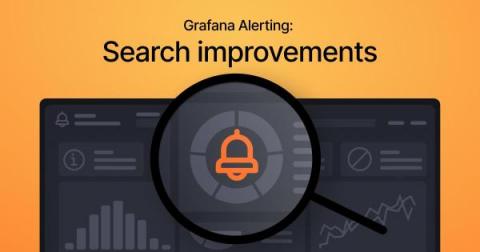
Grafana Alerting: Searching for Grafana alerts just got faster, easier, and more accurate
Grafana Alerting enables users to create and customize alert rules as separate entities and link them to Grafana panels. It also supports various data sources with built-in alerting engines, such as Prometheus, Grafana Mimir, and Grafana Loki, allowing users to manage their alert rules directly from Grafana’s UI.
Dashboard Fridays: Sample VMware dashboard
How to collect and query Kubernetes logs with Grafana Loki, Grafana, and Grafana Agent
Logging in Kubernetes can help you track the health of your cluster and its applications. Logs can be used to identify and debug any issues that occur. Logging can also be used to gain insights into application and system performance. Moreover, collecting and analyzing application and cluster logs can help identify bottlenecks and optimize your deployment for better performance.
How to monitor Microsoft SQL Server performance with Grafana Cloud
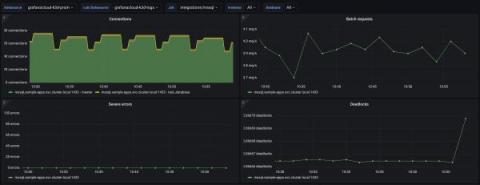
A database is one of the most critical components for almost every application. Making sure it is running with the expected read and write latencies is paramount. This can be the difference between a smooth, pleasing user experience and a slow, error-filled one that makes your customers turn their back on a product — and never come back.
How to get started with monitoring Apache Cassandra with Grafana Cloud
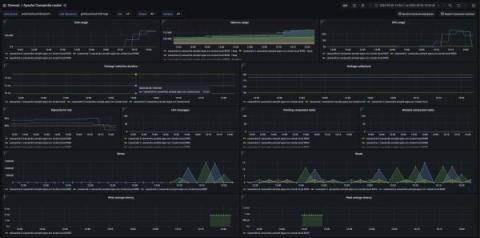
Apache Cassandra is a highly scalable, open source NoSQL database system designed to handle large amounts of data across multiple commodity servers with no single point of failure. Apache Cassandra can be run as a single node but starts making sense when its run in a cluster setup. The system is optimized for high write throughput and is known for its ability to handle big data workloads with ease at super-low latencies.
Scrape Azure metrics and monitor AKS using Grafana Agent
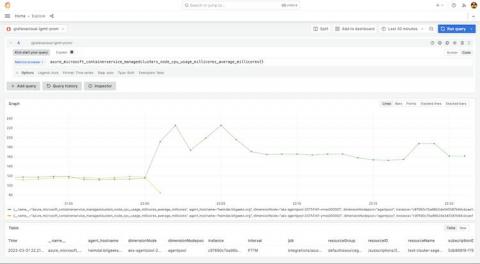
As more organizations adopt cloud-based services like Microsoft Azure Kubernetes Service (AKS), it becomes increasingly important to monitor and manage the performance and reliability of these services. If you’re using AKS today, then Grafana Cloud provides the flexibility, performance, and visualizations you need to monitor your distributed applications.

