Operations | Monitoring | ITSM | DevOps | Cloud
The latest News and Information on Databases and related technologies.
The Present and Future of Data Management Roles
Performance optimization techniques in time series databases: strings interning
VictoriaMetrics is an open-source time-series database (TSDB) written in Go, and I’ve had the pleasure of working on it for the past couple of years. TSDBs have stringent performance requirements, and building VictoriaMetrics has taught me a thing or two about optimization. In this blog post, I’ll share some of the performance tips I’ve learned during my time at VictoriaMetrics.
A guide to PostgreSQL documentation and useful resources | PostgreSQL 101
Why PostgreSQL in 2023 | PostgreSQL 101
The Journey Towards PostgreSQL - Tips and Lessons | PostgreSQL 101
10 PostgreSQL extensions you need to know about | PostgreSQL 101
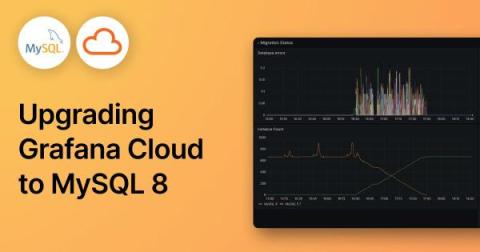
How we upgraded to MySQL 8 in Grafana Cloud
Starting around June this year, we upgraded our Grafana databases in Grafana Cloud from MySQL 5.7 to MySQL 8, due to MySQL 5.7 reaching end-of-life in October. This project involved tens of thousands of customer databases across dozens of MySQL database servers, multiple cloud providers, and many Kubernetes clusters.
Monitoring Redis Performance Metrics
Redis, as an in-memory data store, excels at providing high-speed data access and manipulation. However, without effective monitoring, the potential advantages of Redis can be compromised due to performance bottlenecks, scalability issues, and resource constraints. By closely scrutinizing key metrics, Redis monitoring allows you to proactively detect and address potential problems, ensuring the stability, reliability, and high-performance operation of your Redis environment.
Momentum: Announcing 268 Million Downloads & 320% Growth in 2023
We’re happy to announce a landmark 320% growth in 2023! VictoriaMetrics, our open source time series database and monitoring solution, already hit 268 million downloads this year (still counting), and received close to 13,000 stars on GitHub.


