Operations | Monitoring | ITSM | DevOps | Cloud
The latest News and Information on Databases and related technologies.
VictoriaMetrics Long-Term Support (LTS): Current State
We release VictoriaMetrics several times a month, including at least one major update. However, because these new releases often introduce new features, they may be less stable. That’s why we also regularly publish Long-term support releases (LTS) alongside our regular releases. These LTS versions focus exclusively on bug fixes without new features and performance improvements. We committed to publishing LTS versions every six months and supporting them for one year.
Getting to know Systems insights, a simplified database system monitoring tool
The story of how we simplified database system monitoring for generalists while making it flexible enough for specialists.
SQL Sentry Then and Now Part 2
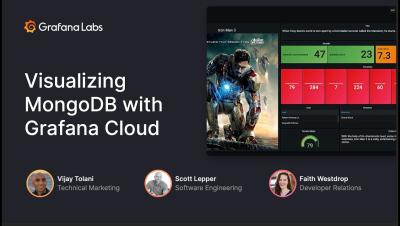
Visualizing MongoDB with Grafana Cloud
Five database DevOps practices for boosting team productivity
Monitoring Kubernetes costs with OpenCost and VictoriaMetrics
Control over operational costs is pivotal in Kubernetes' deployment and management. Although Kubernetes brings power and control over your deployments, it also necessitates thorough understanding and management of costs. OpenCost, specifically designed for Kubernetes cost monitoring, combined with VictoriaMetrics, an efficient time series database, offers a comprehensive solution for this challenge.
How to Monitor SQL Server with OpenTelemetry
Tutorial: Monitoring MySQL Server Performance with Prometheus and sql_exporter
Databases in one form or another are almost an inseparable part of modern applications. A popular one among them is MySQL on which this article will focus. But how to monitor MySQL? This article will give an introduction to this topic.
Planning and Baselining a Migration to Azure SQL
A migration from on-premises SQL Server to Azure SQL offers many customers a number of advantages. It can enable scalability, reduce costs, enhance security, ensure high availability, and simplifies maintenance. Many organizations are looking to equivalent cloud services to move on-prem workloads such as SQL databases to the cloud, freeing themselves from the overheads of purchasing, configuring and maintaining physical hardware and infrastructure.


