Operations | Monitoring | ITSM | DevOps | Cloud

Latest Posts

Kubernetes cost optimization: tips for a more efficient operation

Kubernetes offers unparalleled flexibility and scalability for containerized orchestration. However, this dynamism can also lead to unexpected costs if you don’t efficiently manage your corresponding cloud resources. In this blog, we’ll outline a series of best practices for Kubernetes cost optimization that will help you keep your infrastructure running smoothly while staying within your budget.

New in Grafana k6: The latest OSS features in v0.47.0 and more efficient performance testing in Grafana Cloud k6

Grafana k6 v0.47.0 has been released, featuring gRPC’s binary metadata support, new authentication methods, and tons of other improvements for Grafana k6 OSS. Here’s a quick overview of the latest features in Grafana k6 v0.47.0, as well as some other exciting updates related to Grafana Cloud k6 and the k6 community.

How to easily retrieve values from a range in Grafana using a stat panel

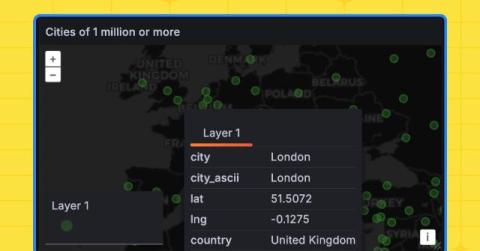
Grafana is an open source visualization and monitoring solution for correlating and analyzing data from various sources. From time series graphs to heatmaps to 3D charts, it gives you lots of ways to untangle complex datasets. And while that’s incredibly powerful for observability, sometimes you’re looking for something fairly straightforward.

Reproducing and testing distributed system failures with xk6-disruptor

Distributed systems, such as modern microservices-based applications, are highly scalable, but also highly complex. Dependencies and unexpected interactions between services are a common cause of incidents, and these incidents are also notoriously hard to test for. xk6-disruptor — an extension that adds fault injection capabilities to Grafana k6, the open source reliability and load testing tool — can help overcome these challenges.

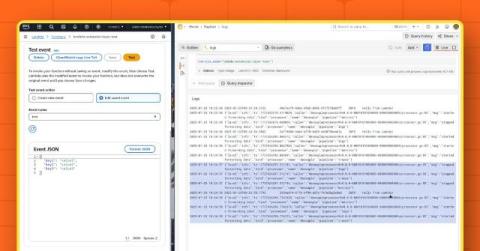
Send Lambda traces to Grafana Cloud with OpenTelemetry

AWS’s serverless technologies are popular because they provide cost effective scaling and great separation of concerns. However, observing serverless architectures like Lambda is challenging due to their transient nature and abstracted infrastructure. Unlike traditional systems with consistent hosts, serverless functions are ephemeral, often scaling rapidly and operating in isolation.

How to embed Grafana dashboards into web applications

Grafana dashboards are powerful and flexible tools for observing applications and infrastructure, so it’s no surprise we get a lot of questions from the community about how to embed them into their web applications. Over the past few releases, we’ve developed a lot of options for how to do this in Grafana, but there can be confusion about how they work, and when to use each approach.

Grafana Agent v0.37: Feature parity between Static and Flow mode, easy migration configs, and more

Grafana Agent v0.37 is here! This new release brings a lot of exciting new features and marks the pinnacle of a year-long effort to achieve feature parity between Grafana Agent Flow mode and Grafana Agent Static mode. We also extended our config converter to ease the migration from Static to Flow mode and we added the possibility to split your Flow configuration into multiple files. Please make note of some breaking changes in this release.

Unify and query private network data in Grafana Cloud: Private Data Source Connect is now GA

You may be ready to make the move to Grafana Cloud, but securely querying private data has been a blocker. If you wanted to query a network-secured data source like a MySQL database or an Elasticsearch cluster that is hosted in an on-premises private network or a Virtual Private Cloud (VPC), you needed to open your network to inbound queries from a range of IP addresses.