Operations | Monitoring | ITSM | DevOps | Cloud

Latest Posts

Grafana Loki 2.9 release: TSDB volume endpoints, remote rule evaluations, LogQL optimizations

The Loki squad is excited to announce Grafana Loki 2.9 is here! For this release, we’ve developed additional TSDB endpoints to help you better understand your log volume; introduced query language optimizations to make parsing more performant; and restructured our documentation so it is easier to use. This coincides with the release of Grafana Enterprise Logs (GEL) 1.8, so all the features discussed here are available in both Loki 2.9 and GEL 1.8.

How to use the Grafana Faro Web SDK with Grafana Cloud Frontend Observability to gain additional app insights

Frontend observability (or real user monitoring) is a critical, yet often overlooked, part of systems monitoring. Website and mobile app frontends are just as complex, if not more so, than the backend systems observability teams typically prioritize. They also represent the first interaction users have with our applications — so it’s important to have full visibility into that experience.

Simplify observability with the Grafana OpenTelemetry Starter and Spring Boot 3

To help simplify instrumenting Spring Boot applications with Grafana Cloud, we are excited to introduce the Grafana OpenTelemetry Starter, a project that connects the latest Micrometer enhancements from Spring Boot 3 with Grafana Cloud using OpenTelemetry. By using these tools, you will have logs, metrics, and traces in a single service — in the same easy way that you can use Prometheus with Spring Boot.

What makes a good open source community?

Whenever you use open source software, you benefit from the community that surrounds it — whether it’s a bug fix, better documentation, a helpful tutorial or something else. We at Grafana Labs benefit from the open source community, too: from your participation, and the many OSS components we use in the development of Grafana itself. But what makes an open source community successful, exactly? And how do you build and nurture one?

A better Grafana OnCall: web-based scheduling, mobile app, email support

Does anyone really enjoy being on-call? That looming dread over what could go wrong? The alarms in the middle of the night when everything does in fact go wrong? Of course not! But that doesn’t mean on-call shifts need to be a giant bundle of anxiety and exhaustion. This is something near and dear to our hearts at Grafana Labs, since the majority of our engineers participate in on-call shifts.

How to configure Grafana Incident with Microsoft Teams

Grafana Incident, the powerful incident response tool that is part of the Grafana IRM suite in Grafana Cloud, comes with a range of integrations out of the box, including Zoom and Google Meet spaces, GitHub and JIRA issues, and even a Google Doc template for post-incident review documents. One of the key features in Grafana Incident is the chatbot integration, which previously only supported Slack.

Grafana JSON API: How to import third-party data sources in Grafana Cloud

Have you ever wanted to test out Grafana Cloud but don’t have any available data to monitor? Well, have no fear! With the Grafana JSON API plugin, you can query publicly available JSON endpoints. The JSON API is a wonderful way to start using Grafana Cloud. You can quickly see data in action, and there are a multitude of things you can build, analyze, and monitor using the JSON API.

Grafana Pyroscope 1.0 release: continuous profiling for a modern open source observability stack

When we launched Pyroscope in 2021, we had one clear goal: Give developers a powerful open source continuous profiling tool for collecting, storing, and analyzing profiling data. Grafana Labs had a similar goal when they released Grafana Phlare, a horizontally scalable, highly available open source profiling solution inspired by databases like Grafana Loki, Grafana Mimir, and Grafana Tempo.

Centralize AWS observability with Grafana Cloud

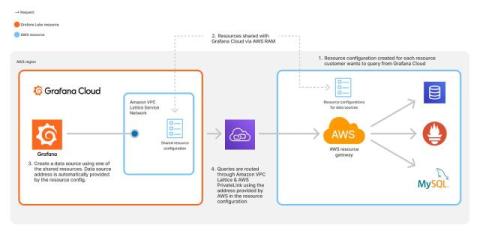
If you’re using AWS, you’re almost certainly using Amazon CloudWatch to collect and analyze observability data from your favorite AWS services. And while AWS remains the most broadly adopted cloud platform, not every company uses it exclusively, which means you need a tool that gives a centralized view across all your environments. With Grafana Cloud, you can do just that.

Generative AI at Grafana Labs: what's new, what's next, and our vision for the open source community

As you’d imagine, generative AI has been a huge topic here at Grafana Labs. We’re excited about its potential role in bridging the gap between people and the beyond-human scale of observability data we work with every day. We’ve also been talking a lot about where open source fits in — especially if that Google researcher is right and OSS will outcompete OpenAI and friends. What role can we play to bring the community along?