Operations | Monitoring | ITSM | DevOps | Cloud

Latest Posts

Unify your observability signals with Grafana Cloud Profiles, now GA

Observability has traditionally been conceptualized in terms of three core facets: logs, metrics, and traces. For years, these elements have been seen as the “pillars” of observability, serving as the foundational components for system monitoring and delivering key insights to improve system performance. However, with the exponential growth in system complexity, a more comprehensive and unified perspective on observability has become necessary.

What's new in distributed trace visualization in Grafana

At Grafana Labs, we are constantly improving our feature set, and tracing is no different. Traces are often overshadowed by logs and metrics, but they’re a pillar of observability for a reason. Used correctly, organizations that can quickly and successfully follow a chain of events through a system gain a more holistic view of their systems and are better equipped to find and fix issues faster.

Managing Prometheus cardinality in Grafana Cloud: Adaptive Metrics FAQ

One of the most talked about topics in observability today is centered around the question of how to get more value out of the ever-increasing amount of data collected by agents, collectors, scrapers, and the like. Back in May, we announced Adaptive Metrics, a new feature in Grafana Cloud that allows you to reduce the cardinality of Prometheus metrics and the overall volume and costs of your metrics.

New in Grafana 10: Grafana Scenes for building dynamic dashboarding experiences

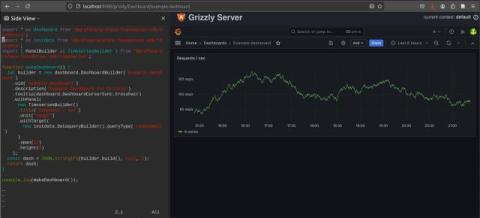
With Grafana 10, the latest major release of our data visualization platform, we wanted to explore new ways to empower our developer community. Case in point: Grafana Scenes, a new frontend library that enables developers to create dashboard-like experiences — such as querying and transformations, dynamic panel rendering, and time ranges — directly within their Grafana application plugins.

Grafana Tempo 2.2 release: TraceQL structural operators are here!

Get excited about Grafana Tempo 2.2! Not only is this release on time, but it is also chock full of TraceQL features and performance improvements. I was honestly a little shocked by how much we have accomplished in the last three months when summarizing the changelog.

Grafana Cloud Free: Actual stories about our 'actually useful' hosted free tier

It’s no secret that anyone can download our open source software and run it, because — once more with feeling — open source is in our DNA. But it can be hard to set up and configure a whole stack from scratch, which is why we offer Grafana Cloud as a fully managed observability platform.

How to monitor your feature flags with LaunchDarkly and Grafana

Feature management is an emerging set of tools and techniques for developing and testing software based around feature flags. It’s intended to increase productivity and performance, as well as improve software quality. Of course, you’ll also need to keep tabs on all those feature flags, so it only makes sense to pair feature management with observability for a more holistic view of your software development cycles.

How Grafana query caching and Amazon Timestream make dashboards faster and more cost-effective

This blog post was co-authored by Igor Shvartser, Senior Technical Product Manager at Amazon Timestream, and Michael Mandrus, Senior Software Engineer at Grafana Labs. Grafana Labs Senior Software Engineers Stephanie Hingtgen and Kevin Minehart also helped with the content.

Simplify managing Grafana Tempo instances in Kubernetes with the Tempo Operator

I’ve been working with Grafana Tempo for about half a year now, and one thing I like about it is that Tempo requires only object storage for storing traces, which is easy to set up in both cloud environments and on-premises. Another outstanding feature is TraceQL, which allows searching for relevant traces with a powerful query language.

New in Grafana 10: A UI to easily configure SAML authentication

In addition to the built-in user authentication that utilizes usernames and passwords, Grafana also provides support for various mechanisms to authenticate users, so you can securely integrate your instance with external identity providers. We are excited to announce that with the release of Grafana 10.0, we have introduced a new user interface that simplifies the configuration of SAML authentication for your Grafana instances.