Operations | Monitoring | ITSM | DevOps | Cloud

Latest Posts

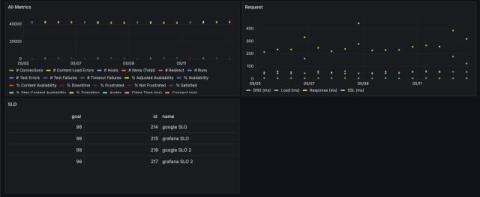
Monitor the past, present, and future of your Kubernetes resource utilization

Greetings, Kubernetes Time Lords! Through a series of recent updates to our multi-purpose Kubernetes Monitoring solution in Grafana Cloud, we’ve made it easier than ever to assess your resource utilization, whether you’re looking at yesterday, today, or tomorrow. All companies that use Kubernetes, regardless of size, should monitor their available resource utilization. If a fleet is under-provisioned, the performance and availability of applications and services are at serious risk.

Trusted Types: How we mitigate XSS threats in Grafana 10

Grafana is a rich platform for data visualization, giving you full control over how your data should be visualized. However, this flexibility and freedom comes with some challenges from a security perspective — challenges that need to be solved to protect the data in Grafana. For years, cross-site scripting (XSS) has been among the most common web application security vulnerabilities.

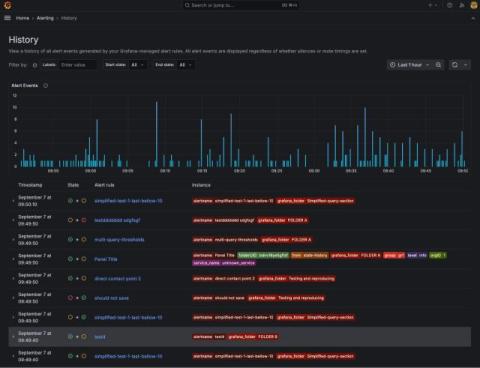
How we improved Grafana's alert state history to provide better insights into your alerting data

The Prometheus alerting model is a flexible tool in every observability toolkit. When enhanced with Grafana data sources, you can easily alert on any data, anywhere it might live, using the battle-tested label semantics and alerting state machine that Prometheus defines. Often, engineers want to see patterns in their alerts over time, in order to observe trends, make predictions, and even debug alerts that might be firing too often.

How to visualize time series from SQL databases with Grafana

Relational databases like MySQL, PostgreSQL, Oracle, and others have a wealth of time series data locked inside of them. Often this data can be used to enhance observability dashboards, or keep track of important application factors, like how many users have signed up for a service. In this article, we’re going to show you how to visualize any time series from any SQL database in Grafana using the time series visualization.

Breaking the memory barrier: How Grafana Mimir's store-gateway overcame out-of-memory errors

Grafana Mimir is an open source distributed time series database. Publicly launched in March 2022, Mimir has been designed for storing and querying metrics at any scale. Highly available, highly performant, and cost-effective, Mimir is the underlying system powering Grafana Cloud Metrics, and it’s used by a growing open source community that includes individual users, small start-up companies, and large enterprises like OVHcloud.

How to run faster Loki metric queries with more accurate results

Today I want to talk about metric queries. More specifically, I want to talk about an important concept that is going to make your queries run faster, give you more accurate results, and make your Grafana Loki operators (like me) much happier. A metric query in Loki looks like this: And the part I want to talk about is that at the end. Now, if you’re like me and have a short attention span and are already bored — I understand.

How to fix performance issues using k6 and the Grafana LGTM Stack

The Grafana Labs ecosystem is built on a range of different projects that incorporate logs, metrics, traces across load testing, and Kubernetes monitoring. I’ll assume you know all of that data (and more!) can be visualized in Grafana. What made my observability dream become reality, though, is how these systems can work together to help you effectively debug performance issues and operate your system with more confidence.

How Ultimate improved workflow, adoption, and more with Grafana IRM

“So you get paged and wake up in the middle of the night, you don’t know what’s going on, and there you are needing to figure things out — What kind of tabs do I need open? Where do I find the logs? Where are the dashboards and the metrics?” If you’ve ever been on call, this refrain, voiced by Alexander Rösel, Senior Software Engineer at Ultimate, will sound all too familiar.

Build better PromQL queries with Grafana's metrics explorer

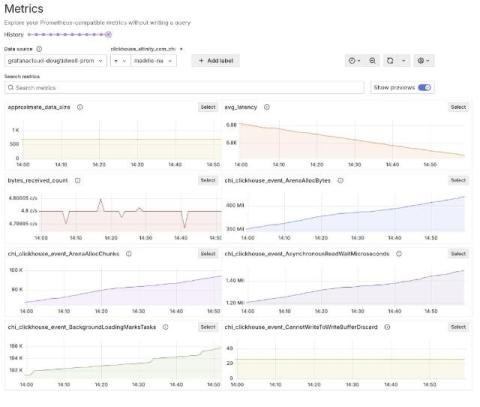
As more people and organizations adopt Prometheus and Grafana for observability, we at Grafana Labs want to make it easier for this expanding pool of users to answer questions about their systems, regardless of whether they’re experts or novices. That’s why we’re adding a feature to enhance metric browsing in the Prometheus query builder in addition to the metric select.

Watch Grafana 10 demos: New visualizations, plugin tools, and more from the latest Grafana release

With every major release of Grafana, we strive to give our users a broader, more powerful and more streamlined set of features for data visualization. Grafana 10, unveiled this month at GrafanaCON 2023, is certainly no exception. From more intuitive navigation to updated plugin development tools, Grafana 10 enhancements benefit new and seasoned users alike.