Operations | Monitoring | ITSM | DevOps | Cloud

Latest Posts

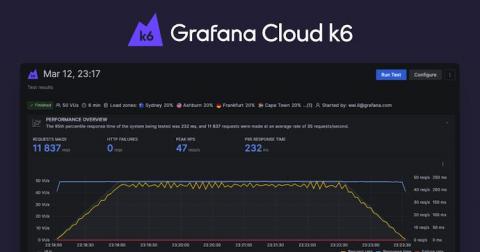
k6 introduces browser automation and Prometheus support in k6 OSS

While there is a lot of focus on the three pillars of observability to provide insight into application performance in production, load testing is the other side of the observability story. By using the open source load testing tool k6 — which Grafana Labs acquired earlier this year — developers can simulate real-world traffic to test the reliability and performance of software changes and new features, not to mention flag performance issues before impacting end users.

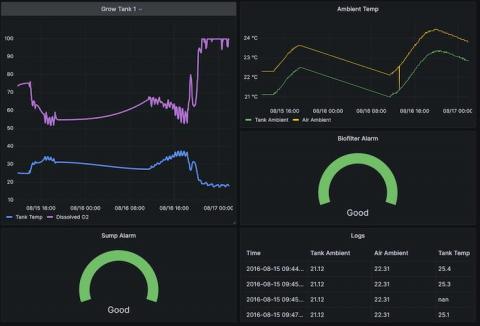
Visualizing IoT security metrics with Grafana at Network to Code

As the number of connected gadgets in our homes, offices, and industrial networks continues to grow exponentially, keeping IoT devices secure has become a vital part of our everyday lives. However, our webcams, printers, and smart plugs often lack security features due to their fast time to market, making them particularly vulnerable to attack. And because security metrics themselves can be tricky to assess, tracking IoT device security is increasingly a challenge.

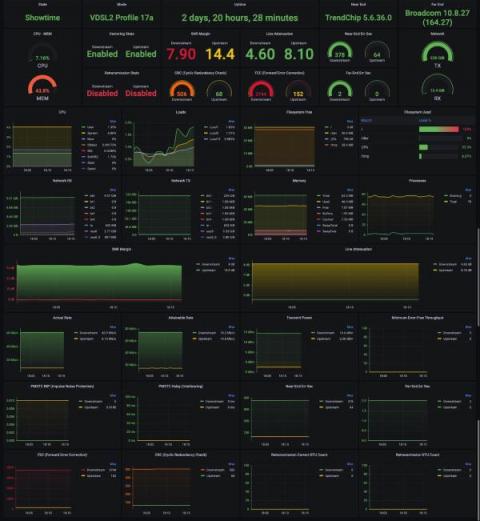
How Snyk, TripAdvisor, and Citibank use Grafana to effectively scale observability

It’s one thing to set up an observability strategy. But what’s it like to introduce and scale observability effectively across an organization? In a wide-ranging conversation at ObservabilityCON 2021, three technical pros from Snyk, TripAdvisor, and Citibank joined Grafana Labs VP Global Solutions Engineering Steve Mayzak and — with more than 75 years experience between them — they shared the triumphs and turbulence in their respective observability journeys.

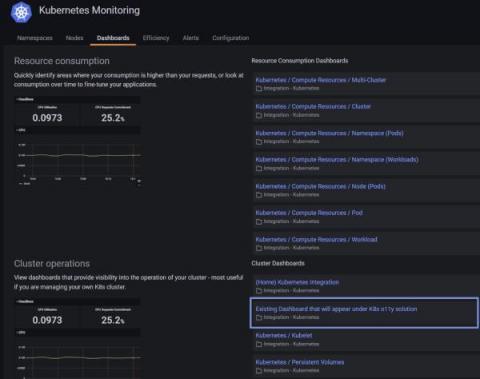
A 3-step guide to troubleshooting and visualizing Kubernetes with Grafana Cloud

Back in May, we announced the Kubernetes integration to help users easily monitor and alert on core Kubernetes cluster metrics using the Grafana Agent, our lightweight observability data collector optimized for sending metric, log, and trace data to Grafana Cloud. Since then, we’ve made some improvements to help our customers go even further.

Video: The new simple, scalable deployment for Grafana Loki and Grafana Enterprise Logs

With the recent release of Loki 2.4 and Grafana Enterprise Logs 1.2, we’re excited to introduce a new deployment architecture. Previously, if you wanted to scale a Loki installation, your options were: 1) run multiple instances of a single binary (not recommended!), or 2) run Loki as microservices. The first option was easy, but it led to brittle environments where a heavy query load could take down data ingestion and problems were often difficult to debug.

Introducing the AWS CloudWatch integration, Grafana Cloud's first fully managed integration

At Grafana Labs, we are continuing to build integrations that make it easier than ever to observe your systems, no matter which tools or software you choose. Today, we’re excited to talk about the latest integration available in Grafana Cloud: the AWS CloudWatch metrics integration, the first of our fully managed integrations that makes it simple to connect and visualize your data in Grafana.

Why we created a Prometheus Agent mode from the Grafana Agent

On 2021-10-29, initial support for Prometheus Agent was merged, and it is slated for inclusion in Prometheus v2.32! This feature has a bit of a lengthy history to it: It took a little while to get to where we are today, but I’m thrilled that we were able to use the Grafana Agent code to enable agent-like functionality in the prometheus/prometheus repository.

Loki 2.4 is easier to run with a new simplified deployment model

Loki 2.4 is here! It comes with a very long list of cool new features, but there are a couple things I really want to focus on here. Be sure to check out the full release notes and of course the upgrade guide to get all the latest info about upgrading Loki. Also check out our ObservabilityCON 2021 session Why Loki is easier to use and operate than ever before.

Grafana Tempo 1.2 released: New features make monitoring traces 2x more efficient

Grafana Tempo 1.2 has been released! Among other things, we are proud to present both our first version to support search and the most performant version of Tempo ever released. There are also some minor breaking changes so make sure to check those out below. If you want ALL the details you can always check out the v1.2 changelog, but if that’s too much, this post will cover all the big ticket items.

Introducing Grafana Enterprise Traces, joining metrics and logs in the Grafana Enterprise Stack observability solution

Today, we are launching a new Grafana Labs product, Grafana Enterprise Traces. Powered by Grafana Tempo, our open source distributed tracing backend,.and built by the maintainers of the project, this offering is an exciting addition to our growing self-managed observability stack tailored for enterprises.