Operations | Monitoring | ITSM | DevOps | Cloud

Latest Posts

Intro to distributed tracing with Tempo, OpenTelemetry, and Grafana Cloud

I’ve spent most of my career working with tech in various forms, and for the last ten years or so, I’ve focused a lot on building, maintaining, and operating robust, reliable systems. This has led me to put a lot of time into researching, evaluating, and implementing different solutions for automatic failure detection, monitoring, and more recently, observability. Before we get started: What is observability?

How Sitech builds modern industrial IoT monitoring solutions on Grafana Cloud

Chemelot is an industrial park in the Netherlands with more than 150 companies in chemical and process industries that are working to build the most sustainable and competitive chemical site in Western Europe. Sitech Services is part of making that happen. The Dutch technology firm brings together maintenance and engineering specialists with data scientists to create multidisciplinary solutions that achieve optimal safety, efficient infrastructure, and efficient processes for the plants.

With Grafana and InfluxDB, CSS Electronics visualizes CAN IoT data to monitor vehicles and machinery

Martin Falch, co-owner and head of sales and marketing at CSS Electronics, is an expert on “CAN bus” data. Martin works closely with end users, typically OEM engineers, across diverse industries (automotive, heavy-duty, maritime, industrial). He is passionate about open source software and has been spearheading the integration of the CANedge with InfluxDB databases and Grafana telematics dashboards.

How we use Grafana and Prometheus to monitor the traffic of our many GitHub repositories

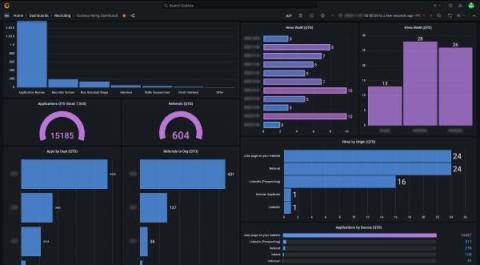
If you want to understand the popularity of your GitHub repositories, knowing the number of stars isn’t enough. GitHub understands this, and that’s why the team released traffic insights. Anyone with push access to a repository can view these insights, which include: full clones, visitors from the past 14 days, referring sites, and popular content in the traffic graph.

Avoid dropped logs due to out-of-order timestamps with a new Loki feature

Dropped log lines due to out-of-order timestamps can be a thing of the past! Allowing out-of-order writes has been one of the most-requested features for Loki, and we’re happy to announce that in the upcoming v2.4 release, the requirement to have log lines arrive in order by timestamp will be lifted. Simple configuration will allow out-of-order writes for Loki v2.4.

How the new Datadog plugin enhancements extend interoperability for our customers

At Grafana Labs, we have a “big tent” philosophy: We believe our users should be able to determine their own observability strategy and choose their own tools, so we help users bring different data sources together. Datadog is a powerful product used by many teams, and we hear a lot from customers about how we should further embrace and support this critical data source — which is why we created the Datadog data source plugin a few years ago.

What's new in Grafana Cloud for September 2021: New panels, query caching, synthetic monitoring updates, and more

Here at Grafana, we’re constantly shipping new features to help our users get the most out of Grafana Cloud. Over the last few months, we’ve made it even easier to get started with out-of-the-box dashboards and new visualizations in Grafana Cloud. We also introduced capabilities like query caching, a “prettify JSON” option and commands for cortex-tools to make your data, dashboards, and queries more efficient.

New in Grafana 8.1: Gradient mode for Time series visualizations and dynamic panel configuration

Grafana 8 brought with it many exciting new features, including the launch of a new alerting system and the expansion of Grafana’s live and streaming data functionality. We didn’t stop there. In Grafana 8.1, alongside new additions like the Geomap and Annotations panel, we introduced some new features to the Time series panel as well as two transformations to help make panel configuration more dynamic.

How to use AWS IoT SiteWise Edge and Grafana to collect and monitor industrial data on-premises

The AWS IoT SiteWise plugin for Grafana was created to enable AWS IoT SiteWise customers to visualize and monitor industrial equipment data using Grafana dashboards. Industrial customers use AWS IoT SiteWise to collect, process, and monitor their industrial data at scale. This plugin allows them to use Grafana dashboards to monitor this data, stored by AWS IoT SiteWise in the AWS Cloud.

Introducing the Lightstep Metrics plugin for Grafana

Chris Sackes is a Software Engineer at Lightstep. A New Yorker by birth, he loves public transportation, architecture photography, and urban exploration. He’s spent the last five years engineering delightful user experiences for a variety of applications. Lightstep’s powerful metrics reporting and analysis are now available for Grafana users. Using the new Lightstep Metrics plugin for Grafana, you can view metrics data reported to Lightstep directly in your Grafana instance.