Operations | Monitoring | ITSM | DevOps | Cloud
Latest News
The Power of Distributed Tracing in Shifting Observability Left
This is the second post in a 3-part series about shifting Observability left. If you have not had a chance to read the first, you can find it here. In today’s complex microservices deployments, gaining visibility into deployments is vital for optimal system performance and scalability. This has become even more important as the tech industry has moved toward microservice architecture reliance. Navigating through logs has become increasingly complex as requirements have grown.
Shifting Observability Left - Empowering Developers
This is the first post in a 3-part series about shifting Observability left. When it comes to the reliability and performance of your applications, compromise is not an option in the world of software development. This is where observability can help developers achieve a more robust and scalable infrastructure.
5 Strategies to Reduce Your AWS Lambda Expenses Efficiently
As a serverless computing service, AWS Lambda has revolutionized deployment with its pay-as-you-go model. Yet, users often grapple with unexpected costs. This guide underscores the criticality of cost optimization and prepares to unveil quintessential strategies to trim down your Lambda bills without compromising performance.
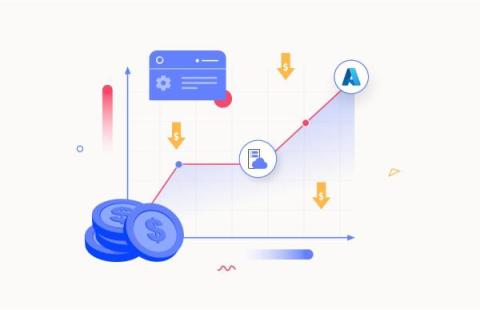
Azure Logic Apps costs optimization to maximize savings
Azure Horizontal vs Vertical Scaling: Which is Right for You?
Azure VM Rightsizing for Performance Excellence and Cost Control
A Bright New Era in Developer Troubleshooting with Lumigo and OpenTelemetry
At Lumigo, building developer-first tools has always been at the forefront of our approach to troubleshooting and debugging. As developers ourselves, we have experienced firsthand the frustration and intricacies of sifting through logs looking for answers. We’ve also felt the pressure of the clock ticking, with production issues waiting to be resolved and the need for timely answers to surfaced application issues.
Optimize Azure App Service costs professionally for peak savings
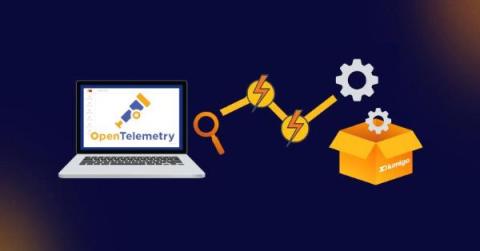
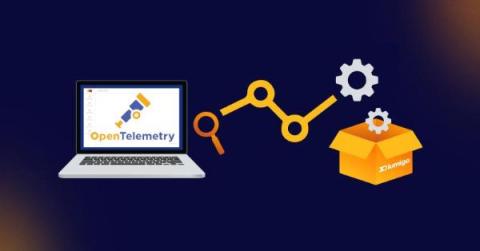
Lumigo Releases 1-Click OpenTelemetry for Microservices Troubleshooting
Lumigo is excited to announce its microservice troubleshooting platform now provides developers and DevOps with the power of OpenTelemetry (OTel) with a single click. Lumigo has long been the leading troubleshooting platform for serverless, but now, users can harness its best-in-class debugging and observability platform for all microservices-based environments.


