Operations | Monitoring | ITSM | DevOps | Cloud
Latest News
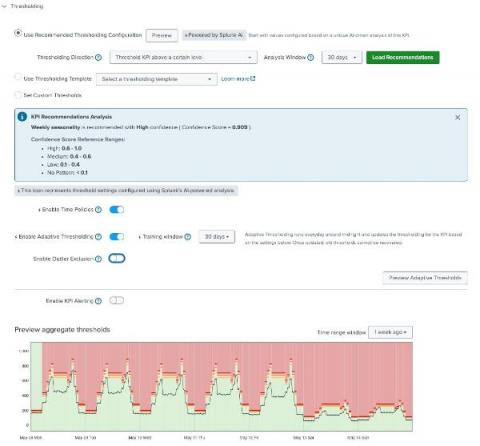
ML-Powered Assistance for Adaptive Thresholding in ITSI
DataDog Flex Logs vs Coralogix Remote Query
While Coralogix Remote Query is a solution to constant reingestion of logs, there are few other options today that also offer customers the ability to query unindexed log data. For instance, DataDog has recently introduced Flex Logs to enable their customers to store logs in a lower cost storage tier. Let’s go over the differences between Coralogix Remote Query vs Flex Logs and see how DataDog compares. Get a strong full-stack observability platform to scale your organization now.
Cribl Makes Waves at Black Hat USA 2023, Unveils Strategic Partnership with Exabeam to Accelerate Technology Adoption for Customers
One of our core values at Cribl is Customers First, Always. These aren’t just buzzwords we use to sound customer friendly; it’s ingrained in our daily communication and workload. Without our customers, we wouldn’t exist. One of the ways we’ve upheld this value is to seek out strategic partnerships with other companies aligned with our customers’ needs – both present and future.
Mainframe Observability with Elastic and Kyndryl
As we navigate our fast-paced digital era, organizations across various industries are in constant pursuit of strategies for efficient monitoring, performance tuning, and continuous improvement of their services. Elastic® and Kyndryl have come together to offer a solution for Mainframe Observability, engineered with an emphasis on organizations that are heavily reliant on mainframes, including the financial services industry (FSI), healthcare, retail, and manufacturing sectors.
Improved cost visibility and 60 percent price drop for Managed Service for Prometheus
We’ve dropped pricing for samples ingested into Managed Service for Prometheus by 60%, and improved our metrics management interface.
IT Event Correlation: Software, Techniques and Benefits
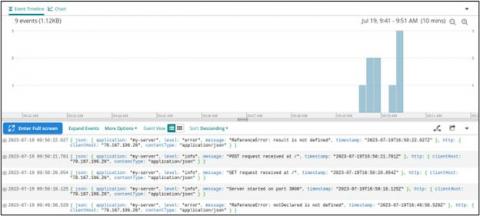
4 Node.js Logging libraries which make sophisticated logging simpler
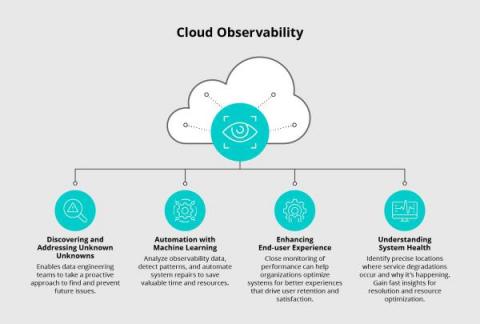
Cloud Observability: Unlocking Performance, Cost, and Security in Your Environment
A robust observability strategy forms the backbone of a successful cloud environment. By understanding cloud observability and its benefits, businesses gain the ability to closely monitor and comprehend the health and performance of various systems, applications, and services in use. This becomes particularly critical in the context of cloud computing. The resources and services are hosted in the cloud and accessed through different tools and interfaces.
IDC Market Perspective published on the Elastic AI Assistant
IDC published a Market Perspective report discussing implementations to leverage Generative AI. The report calls out the Elastic AI Assistant, its value, and the functionality it provides. Of the various AI Assistants launched across the industry, many of them have not been made available to the broader practitioner ecosystem and therefore have not been tested. With Elastic AI Assistant, we’ve scaled out of that trend to provide working capabilities now.


