Operations | Monitoring | ITSM | DevOps | Cloud

Latest News

Introducing New Storage Dashboards in the Cloud Monitoring Console (CMC)

Monitoring and gaining additional insights about usage of your Splunk Cloud Platform deployment is essential for effective management as a Splunk admin. Your Splunk Cloud comes with the Cloud Monitoring Console (CMC) app, which displays relevant information about the status of your Splunk Cloud environment using pre-built dashboards.

How to Detect Memory Leaks in Java: Common Causes & Best Tools to Avoid Them

There are multiple reasons why Java and the Java Virtual Machine-based languages are very popular among developers. A rich ecosystem with lots of open-source frameworks that can be easily incorporated and used is only one of them. The second, in my opinion, is the automatic memory management with a powerful garbage collector. The Java garbage collector, or in short, the GC, takes care of cleaning up the unused bits and pieces.

AppScope 1.0: Changing the Game for Infosec, Part 1

This is one of a series of blogs in which we introduce AppScope 1.0 with stories that demonstrate how AppScope changes the game for SREs and developers, as well as Infosec, DevSecOps, and ITOps practitioners. In the coming weeks, Part 2 of this post will tackle another Infosec use case. If you’re in Infosec, at some point you’ve doubtless had to vet an application before it’s allowed to run in an enterprise environment.

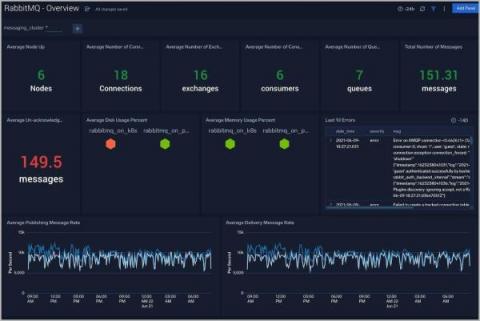
How to monitor RabbitMQ logs and metrics with Sumo Logic

As organizations have moved toward a microservices design pattern, the need for reliable and performant solutions that enable decoupled services to communicate with one another has grown. RabbitMQ is an open-source message broker designed for this purpose. We’ll discuss what RabbitMQ is, how it works, why it needs to be monitored and how Sumo Logic can effectively do this.

Your Clients Financial Real-Time Data: Five Factors to Keep in Mind

Real-time data is where information is collected, immediately processed, and then delivered to users to make informed decisions at the moment. Health and fitness wearables such as Fitbits are a prime example of monitoring stats such as heart rate and the number of steps in real-time. These numbers enable both users and health professionals to identify any results, existing or potential risks, without delay.

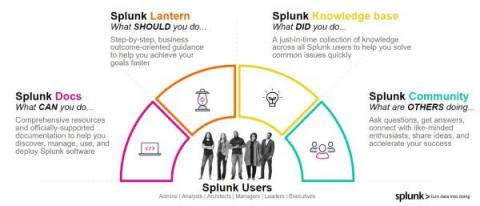
Help Yourself to Splunk Knowledge

How do I…? During your time as a Splunk customer, you will begin many of your questions this way. Our products have a lot of features to grasp, a lot of flexibility to master, and a lot of power to help you solve your business problems. Learning how to get the maximum value out of our capabilities can take some time. That is why there are dedicated groups of Splunk knowledge workers creating content to help you take advantage of opportunities quickly.

SaaS Observability Done Right

SaaS (software as a service) is the common model for many businesses today. Even longstanding behemoths such as Cisco and Microsoft have been strategically shifting their software products to SaaS and recurring revenue models (just think Office365 shift from licensed Office). These SaaS businesses need agility to move fast and remain competitive. This means agility in the IT stack, but also agility in the business models to support bottom-up GTM and product-led growth (PLG).

Splunk UI and the Dashboard Framework: More Visual Control Than Ever

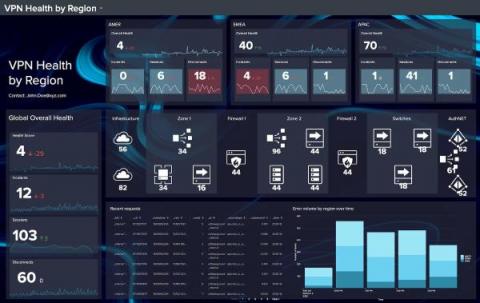
If you attended.conf21, or followed any Splunk blogs by Lizzy Li for the past year, then you likely have heard of Splunk Dashboard Studio — our new built-in dashboarding experience included in Splunk Enterprise 8.2 and higher and Splunk Cloud Platform 8.1.2103 and higher. With new, beautiful visualizations and the ability for more visual control over the dashboard, our customers and Splunkers alike have been creating beautiful and insightful dashboards to turn data into doing.