Operations | Monitoring | ITSM | DevOps | Cloud

Latest News

My 3 Lessons About OpenTelemetry for Observability

As a fan of OpenTelemetry, I love to see Cribl meeting customers where they are and helping them get to where they want to be with a vendor-agnostic approach. Where it is not possible or practical to re-instrument a telemetry source, whether an application or infrastructure, the barrier to adopting OpenTelemetry Signals can be daunting.

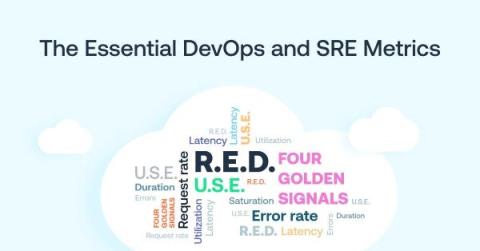
DevOps and SRE Metrics: R.E.D., U.S.E., and the "Four Golden Signals"

In the fast-paced realm of DevOps and Site Reliability Engineering (SRE), success starts with effective monitoring. Understanding the fundamental metrics is crucial for identifying and mitigating issues proactively. In this article, we’ll delve into the leading metrics frameworks — R.E.D., U.S.E., and the “Four Golden Signals” — which will provide you with a solid foundation to enhance your monitoring practices.

Log Formatting: 8 Best Practices for Better Readability

Logs act as silent sentinels, recording every whisper of your application’s activity. They are invaluable chronicles illuminating system behavior, diagnosing issues, and providing crucial insights into your application’s health. However, the true power of logs lies not just in their existence, but in how they are formatted. Log formatting is pivotal in transforming these raw data streams into actionable intelligence.

Isolation: A New Wave of Experiences to Help Teams Work Side by Side

Cribl offers a suite of tools designed to optimize data pipelines, with different components tailored for managing and orchestrating data flows at scale across different teams and data sources. One of the biggest problems with building and running a multi-team data engine is isolation. This blog will cover how we at Cribl have handled the challenge of data, configuration, and access isolation for growing teams.

What is Log Analytics? The Significance of Log Analytics Solutions Explained

Every action, transaction, and interaction in an application generates some sort of data. ThisAnd this data holds a wealth of information that, when collected and analyzed over a period of time, provides a comprehensive view of application behavior and performance. Logging is the most widely used technique for collecting data on application states, transactions, errors, and code flow tracking.

A look at Azure monitoring and troubleshooting

Even now, plenty of businesses are still making the shift to the cloud. Chief decision-makers are plagued by fears about availability, potential downtime and security. Organizations adopting Microsoft Azure need to be able to confidently make the transition without interruptions, which requires building out a strategy for monitoring your Azure environment.