Operations | Monitoring | ITSM | DevOps | Cloud

Latest News

From ELK Stack to easy - Elastic Observability on Elastic Cloud Serverless

Announcing the general availability of Elastic Observability on Elastic Cloud Serverless — a fully managed observability solution As organizations scale, an observability solution that can handle the complexity of distributed cloud environments and provide real-time insights often feels like an insurmountable challenge often due to data- and cost-related compromises.

The future is now, introducing Dynamic Observability from AI innovations built on logs

A year ago, I shared my thoughts at re:Invent, explaining why I joined Sumo Logic as CEO and laid out the importance of logs as a key differentiator. A year later, the atomic level of logs is even more paramount. It’s not just because Sumo Logic is years ahead in technology when it comes to ingesting and analyzing structured and unstructured logs.

The Leading SNMP Monitoring Tools

SNMP, which stands for Simple Network Management Protocol, is often viewed as a legacy protocol, with SNMP not being actively worked on anymore, which led to both Microsoft and Google pronouncing that SNMP was dead. Yet, SNMP is still commonly used by numerous industries as the advantages of SNMP, especially for network monitoring, are profound. Practically, all network components across all vendors possess built-in SNMP capability.

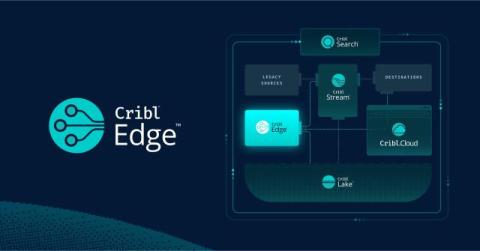
Simplify OpenTelemetry Metrics with Cribl Edge OTLP Conversion

Cribl Edge can send data to OpenTelemetry in several different ways. In this blog post, we’ll focus on the OpenTelemetry Metrics. In the blog, we’ll talk about Cribl Edge, but what we say applies to Cribl Stream, too! We will cover how to use Cribl Edge to collect Linux System Metrics, transform them into the OTLP Metrics format, and deliver them to an OTLP Destination.

Unlocking Insights with Heroku Logs: Complete Guide

Heroku is a popular platform for deploying and scaling applications, and one of its standout features is its centralized logging system. Heroku logs give you visibility into your application’s behaviour, infrastructure events, and platform activities. When paired with a robust monitoring solution like Atatus, you can transform raw log data into actionable insights that keep your applications running smoothly.
Sponsored Post

Going Beyond CloudWatch: 5 Steps to Better Log Analytics & Analysis

Amazon CloudWatch is a great tool for DevOps engineers, developers, SREs, and other IT personnel who require basic Amazon Web Services (AWS) log processing and analytics for cloud services and applications deployed on AWS. However, most developer teams will ultimately need more logging functionality than a basic AWS log analyzer like Amazon Cloudwatch can provide. For example: That's why, although CloudWatch may be one tool in your log analytics strategy, it probably should not be the only one.

Managing Splunk Add-Ons with UCC Framework

At Splunk, we're constantly innovating to make our platform more accessible and powerful for users. Today, we're excited to dive into one of our key tools: the Universal Configuration Console (UCC) framework. This powerful framework is revolutionizing how you can create and manage Splunk add-ons, and we want to show you why it's becoming an essential part of the Splunk ecosystem.

Ingesting JSON Logs From Containers With the OpenTelemetry Collector

It’s very popular to push logs, in a formatted way, to the console output of an application (sometimes referred to as stdout). Although using a push-based approach like OTLP over gRPC/HTTP is preferred and has more benefits, there are many legacy systems that still use this approach. These systems typically use a JSON output for their logs. So, how do we get these JSON logs into a backend analysis system like Honeycomb that primarily accepts OTLP data?