Operations | Monitoring | ITSM | DevOps | Cloud

Latest News

Leveling up your observability practice - Part 2

Lessons from the front lines: Challenges in your observability maturity journey In our previous blog, we explored the observability maturity spectrum — revealing that while only 7% of organizations consider themselves experts, the majority (43%) are actively working to improve their practices. We saw how mature organizations achieve better outcomes, from faster root cause analysis to reduced user-reported incidents.

Grafana Loki 3.3 release: faster query results via Blooms for structured metadata

The Grafana Loki 3.3 release is here, and it brings a fresh wave of enhancements aimed at making your log management experience faster, more efficient, and more scalable. While this update includes the usual round of bug fixes and operational improvements, the standout feature is a shift in how Loki leverages Bloom filters—going from free-text search to harnessing the power of structured metadata.

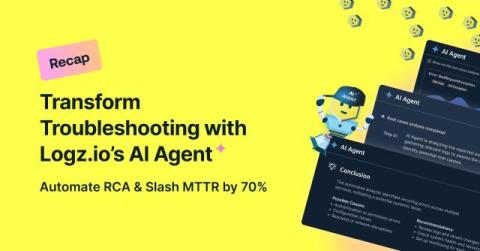
Transform Troubleshooting with Logz.io's AI Agent

As Gartner predicts, AI will support up to 70% of performance monitoring and troubleshooting tasks in the next few years. The Logz.io AI Agent helps teams get ahead of this curve today. Too much time spent troubleshooting? You’re not alone. Manual investigation, jumping between dashboards, and piecing together scattered data are time-consuming and frustrating.

Splunk's Path Towards Achieving FedRAMP Moderate Authorization for Splunk Observability

Splunk continues to partner with government agencies on their digital transformation journeys to help deliver their missions and provide faster and more intelligent services. We are committed to the success and support of the security requirements of our public sector customers, and I am thrilled to share the latest strategic investments Splunk is making to expand our FedRAMP program to include Splunk Observability Cloud for government customers.

Mastering Tail Sampling for OpenTelemetry: Cost-Effective Strategies with Cribl

Recently, I have seen a trend of enterprises moving toward OpenTelemetry (OTel) for application tracing. Tail sampling, in particular, has emerged as a preferred approach to gain actionable insights while balancing data volume and cost. OpenTelemetry offers developers and practitioners the ability to instrument their code with open-source tools, moving away from vendor-provided tools for application instrumentation.

Leveling up your observability practice - Part 1

Lessons from the front lines: Moving to observability maturity What separates the observability experts from the novices? It's a question that's been on my mind lately, especially after diving into our recent 2024 State of Observability Survey of over 500 practitioners. In my past roles as a DevOps engineer and a site reliability engineer (SRE), I've seen firsthand how a mature observability practice can be the difference between sleepless nights and smooth sailing.

Collecting Windows telemetry with Elastic: An introduction to the ETW Filebeat input

In the world of security, being able to use system telemetry of Windows hosts opens new possibilities for monitoring, troubleshooting, and securing IT environments. Recognizing this, Elastic has introduced new capabilities focused on Event Tracing for Windows (ETW) — a powerful Windows-native mechanism for capturing a vast array of system and application events. With these new additions, Elastic users can capture, analyze, and visualize Windows telemetry using the Elastic Search AI Platform.

Safeguarding your future: budget planning for cybersecurity resilience

With remote and hybrid working environments as the norm, organizations need to embrace a modern security paradigm across cross-functional teams. While the primary goal is to deliver confidence, visibility, and robust protection to safeguard their future, balancing the digital transformation journey with budgets can be particularly challenging. Going into budget planning season, these are the challenges to keep top of mind. You can even allocate a line item as you defend your budget and your systems.

What is a Log File? Types Explained with Examples

If you’ve ever spent hours trying to figure out what went wrong in your code, you know how frustrating it can be without a clear trail to follow. Logs give you that trail, showing the steps your system took before something broke. Think of stack traces, they’re helpful for showing you where an error occurred. But they don’t always explain how it occurred. That’s where logs come into place.