Operations | Monitoring | ITSM | DevOps | Cloud

Latest News

Beyond the hype: Is a 10x leap in efficiency possible with AIOps in IT observability?

Now that AI has revolutionized IT forever, what are its implication on IT observability? Typically, IT operations, SREs, and DevOps professionals use IT observability to gain a holistic view of their IT infrastructure. In that pursuit, they used AIOps in several ways. Now, AI has helped IT observability with better anomaly detection, faster root cause analysis, and proactively identifying opportunities to dynamically scale IT to ensure uptime, performance, and security.

Structured Logging Best Practices: Implementation Guide with Examples

In structured logging, log messages are broken down into key-value pairs, making it easier to search, filter, and analyze logs. This is in contrast to traditional logging, which usually consists of unstructured text that is difficult to parse and analyze.

What's That Collector Doing?

The Collector is one of many tools that the OpenTelemetry project provides end users to use in their observability journey. It is a powerful mechanism that can help you collect telemetry in your infrastructure and it is a key component of a telemetry pipeline. The Collector helps you better understand what your systems are doing—but who watches the Collector? Let’s look at how we can understand the Collector by looking at all the signals it’s emitting.

The three pillars of observability

Do you feel you’re always playing catch-up with incidents? If so, you’re not alone. As IT environments become more complex, alerts keep piling up, and finding the root cause feels like searching for a needle in a haystack. And ITOps and incident responders are left scratching their heads and wondering: what went wrong? It can be frustrating when you don’t have end-to-end visibility into your systems. This is where observability comes in.

Monitoring Windows Servers With the OpenTelemetry Collector

This post was written by Martin Thwaites and Vivian Lobo. The OpenTelemetry Collector is an exceptional solution for proxying and enhancing telemetry, but it’s also great for generating telemetry from machines too. In this post, we’ll go through a basic, opinionated setup of using the OpenTelemetry Collector to extract metrics and logs from a Windows server.

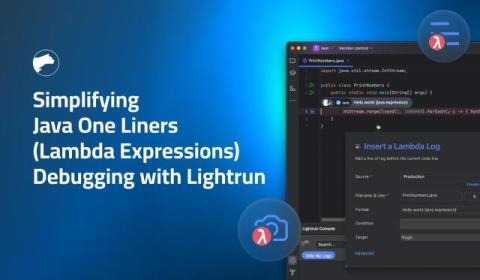
Simplifying Java One Liners (Lambda Expressions) Debugging with Lightrun

In Java programming, lambda expressions or Java one-liners have become widely adopted practices for writing concise and expressive code. These compact, anonymous functions introduce functional programming concepts to Java, streamlining operations on collections, simplifying data manipulation, and enhancing code readability. Introduced in Java 8, lambda expressions are designed to represent blocks of executable code.

Top 10 DigitalOcean Alternatives to Consider in 2025

The 2025 cloud computing landscape presents a diverse array of options beyond DigitalOcean's familiar waters. As businesses outgrow basic cloud solutions, they're discovering platforms that better match their evolving needs. From startups seeking cost-effective scaling to enterprises demanding robust security features, today's cloud providers offer specialized solutions for every use case.

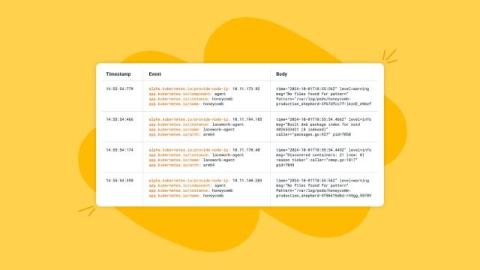
The Log Monitoring Guide for Sweet Insights

Logs are more than just records. With proper log monitoring, they become the honey that sweetens observability. Observability is your ability to understand and optimize your system’s behavior. Turning raw logs into actionable insights requires the right tools, practices, and insights. This blog post is a guide on log monitoring key concepts and best practices for sweetening your observability.