Operations | Monitoring | ITSM | DevOps | Cloud

Latest News

Feature Spotlight: Transaction Check

Uptime’s transaction checks can continually monitor important functionality of your site. Specific steps within a Transaction Check can monitor nearly anything you have a test case for. So, this check is as good as the steps you configure for it. You can think of it as the first response or notification that a portion of critical infrastructure is down.

3 phases of Prometheus adoption.

How to ensure visibility into your next-generation Kubernetes environment. Having assisted hundreds of enterprises in developing a new visibility strategy as they move to Kubernetes, I’ve learned a few things about how organizations learn, evolve and adopt a new method of application observability. Open source is usually essential to developing this understanding.

How to replicate user errors without the user with Breadcrumbs and Sessions

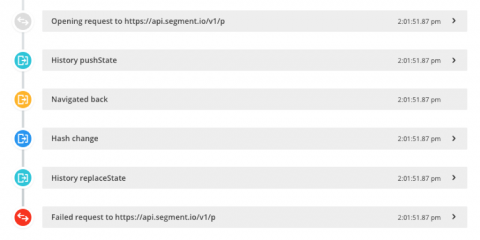
If you need to replicate a user error, you’ll know how difficult it can be to pinpoint the cause. Usually, you’d look at the stack trace or ask the user themselves. However, that’s a lot of guesswork, especially if the stack trace is obfuscated. We’ll show you how to replicate the error faster using Crash Reporting’s Breadcrumbs and the Real User Monitoring Sessions feature.

Introducing the All-New, Reimagined ChangeTower - Here's What's Changed

Meet the new ChangeTower. It’s everything that’s important to you across the internet, in one visual stream. Website content monitoring is about more than just knowing when a change occurs. It’s knowing what changes were made made and how they’re important to you. We’re excited to introduce an all-new, reimagined ChangeTower that helps you filter out the ‘noise’ and stay effortlessly in-the-know across websites.

Using the Content Match feature to detect website defacement

The Content Match feature has the potential to detect and protect against page defacement, as well as fulfilling a few other handy use-cases. Today we’re going to take you through a few of the most common uses of this feature to help you ensure you are getting the most out of it!

Check output metric extraction with InfluxDB & Grafana

Sensu is an extremely powerful standalone monitoring framework, but the real beauty of Sensu lies in its ability to harmoniously interact with, support, and instrument other tools to create a customized and complete monitoring solution. Take metrics for example: Sensu offers multiple mechanisms to monitor performance metrics such as check output metric extraction and StatsD.

What Slack Downtime Costs, and What We Can Do About It

This morning, though, all of our backlogs were a little harder to sift through thanks to a Slack outage in Europe and the US. To calm down, some of us might have turned to our Google Home or Chromecast to unwind while the outage hours piled up, only to find those were down too! What a morning!Now that Slack is running again, let’s take a moment to reflect on what the outage means and what we can learn from it.

How Wix Supports TDD with their TestKit for Sentry's Raven SDK

Ziv Levy, Software Engineer at Wix (a Sentry customer), recently faced two challenges: simulating a bug in Wix code and testing report data. His recent blog post, Meet Raven TestKit: Wix Engineering’s Open Source Tool to Test Sentry Reports, dices into how a plugin for Sentry’s Raven SDK helped him tackle those challenges, with specific documentation detailing what made the choice so simple. Read the post below, and then go try Raven TestKit for yourself (please, and thank you).

Monitor Amazon EKS with AppDynamics

Amazon Elastic Container Service for Kubernetes (EKS) makes it easier to operate Kubernetes clusters, but performance monitoring remains a top challenge. AppDynamics seamlessly integrates into EKS environments, providing insights into the performance of every microservice deployed, all through a single pane of glass.