Operations | Monitoring | ITSM | DevOps | Cloud
Latest News
Server Monitoring 101 - A Detailed Insight
It makes it easier to validate any server’s status without flipping between program and tools if you have one platform to track the servers. Besides, every server with remote server monitoring from a single application viewing window is provided with an accurate and real-time status. You will have the option of simplicity to decide what sort of services you want to track on each server. For instance, only a network storage server used for data backups could control a drive storage area.
VictorOps and Relay for Incident Response
VictorOps is an incident response tool whose mission is straightforward: “To make being on call suck less.” It enables teams to quickly detect and respond to problems like a service degredation or outage. VictorOps supports a wide range of external integrations to extend its capabilities by connecting different parts of your DevOps toolchain.
Bringing Latin America Closer To The Cloud
COVID-19: Lessons from the Trenches
The COVID-19 pandemic has impacted every aspect of life, uniting governments, the scientific community, and healthcare workers around the world in the struggle to get it under control. The pandemic has been a forceful catalyst for healthcare IT Ops change. Infrastructure health and performance optimization has never been more critical to serve the needs of life science research, drug discovery, and hospital care.
Hashicorp Waypoint vs Heroku: What is the best PaaS for your team?
This week, Hashicorp announced the launch of their new product - Waypoint - aiming to simplify the way developers build and run apps in the Cloud and on any platform (like Kubernetes). The project is open source and is well adopted by the dev community. As CEO and co-founder of Qovery, I am enthusiastic to see this product live. At Qovery, we believe in making the developer’s life easier, and seeing big Open Source companies moving in this direction is a good thing for all of us.
SREview Issue #6 October 2020
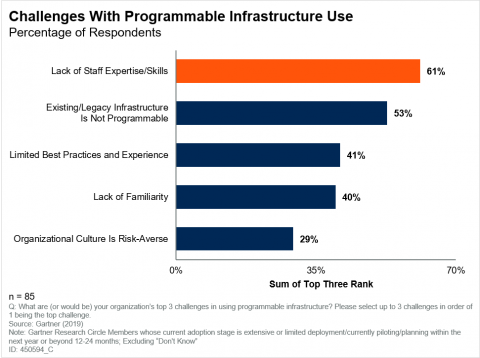
New Gartner Report: How to lead digital disruption with programmable infrastructure
A hybrid infrastructure strategy is integral in creating a successful digital transformation in your enterprise. Programmable infrastructure (PI), or Infrastructure as Code, makes these strategies work in the real world. This blog will cover some highlights from the Gartner Report on why I&O leaders must adopt programmable infrastructure to enhance customer-focused agility.
The Most Important KPIs for Monitoring Mobile Games
Managing modern mobile games involves measuring and tracking dozens of metrics. Each value lets you know how well your game is doing in a specific area, such as user experience, infrastructure, and monetization, to name but a few. But not all KPIs are created equally. Some metrics are more valuable than others in terms of helping you make informed business and technical decisions about your game. That’s what we’ll take a look at in this article.
AWS And Azure Dedicated Hosts Monitoring With VirtualMetric
Amazon Web Services and Microsoft Azure do not need any formal introduction. They are two major players in the cloud computing and virtualization industry. AWS leads with about 32% market share. On the other hand, Azure is the next closest with about 17% market share. Both the tech giants, AWS and Azure, have been on an onward growth trajectory with revenue boosts coming in every quarter.


