Operations | Monitoring | ITSM | DevOps | Cloud

Latest News

Spiceworks research reveals storage, network, desktop, and server virtualization trends

There's no doubt that over the last decade, virtualization technology drastically altered server rooms around the world. Server virtualization has improved IT efficiency while allowing for greater flexibility and redundancy, quickly jumping from a niche technology to one that's used by the vast majority of businesses. With server virtualization now ubiquitous, many businesses are now turning to other forms of virtualization to reap similar IT benefits.

How to Create an Azure Monitor Alert

Azure Monitor gathers performance metrics from your various Azure resources and allows you to explore those metrics through visualizations. It also allows you to manually create alerts that will notify you when a metric crosses a predefined threshold. In this blog post, we’ll cover how to create an alert in Azure Monitor.

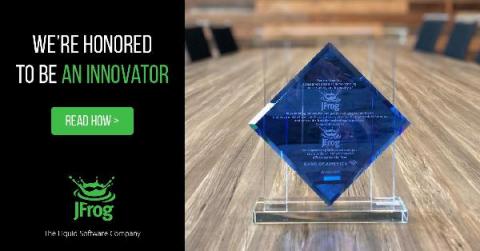
We're Honored: Bank of America Recognizes JFrog for Enterprise DevOps Innovation

Being innovative is like being handsome. It only counts when others think so. When Bank of America honors you for being innovative and improving how their 30,000 developers perform, it’s a very handsome compliment. At the 11th Bank of America Technology Innovation Summit, JFrog was recognized for industrial leadership and excellence in providing global business solutions. This year, JFrog was one of only two technology companies honored for its strong partnership with the firm.

Collecting Amazon MQ metrics and logs

In Part 1 of this series, we saw how Amazon MQ routes messages between services in a distributed application, and we looked at some of the key metrics that describe the performance of the message broker and its destinations. Now that we’ve introduced the metrics and their meaning, we’ll look at some tools you can use to collect and query metrics from Amazon MQ:

Analyzing Amazon MQ performance with Datadog

In Part 2 of this series, we showed you how to use CloudWatch to monitor metrics and logs from Amazon MQ. With CloudWatch, you can easily create ad-hoc graphs to visualize the performance of your messaging infrastructure and other AWS services you use (such as EC2, Lambda, and S3). But to monitor your Amazon MQ brokers, destinations, and clients alongside the rest of your applications and infrastructure, you need a monitoring platform that easily integrates with your whole technology stack.

Monitor your Fargate container logs with FireLens and Datadog

To centralize logging from your entire stack—from traditional infrastructure to serverless components—Datadog is announcing native support for the launch of FireLens for Amazon ECS. FireLens streamlines logging by enabling you to configure a log collection and forwarding tool such as Fluent Bit directly in your Fargate tasks. We’ve partnered with AWS to provide built-in Fluent Bit support for Datadog so that you can now seamlessly route container logs from AWS Fargate.

Upgrading Kubernetes Without Upgrading Rancher

Prior to version 2.3, new versions of Kubernetes came out with point releases of Rancher and required an upgrade to Rancher before they were made available for use. Rancher 2.3 changes that pattern and now makes it possible to update the metadata store for available Kubernetes versions, disconnecting the Rancher server upgrade process from the Kubernetes cluster upgrade process.

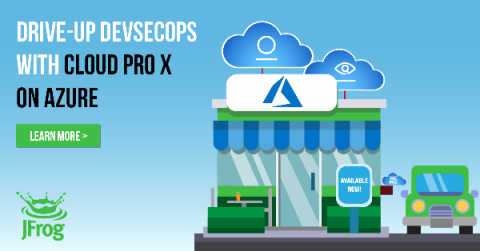
Load Up and Drive Cloud DevSecOps on Azure

At JFrog, we think enabling DevSecOps in the cloud should be as easy as ordering from a drive-up window. Getting the tools you need for digital transformation should only be a short stop on your long journey. And you should be able to get it your way, on the cloud services platforms you choose. That’s why we’re excited to announce the availability of JFrog Cloud Pro X on Azure Marketplace.

Major Media Take Notice of the Virtana Unveiling

It’s been almost two weeks since we said goodbye to Virtual Instruments, and hello to Virtana – a company focused on helping customers take a modern, AIOps-empowered approach to managing their hybrid IT infrastructure. As part of introducing the world to Virtana, we also announced the launch of the latest addition to our portfolio of hybrid infrastruture monitoring solutions – CloudWisdom.