Operations | Monitoring | ITSM | DevOps | Cloud
Latest News
Top 5 Preview Environments Products to Consider in 2023
Grafana vs. SolarWinds - The Dashboards
Dashboards are great ways to visualize different KPIs in a single place. Metrics from all over your system can be framed together and viewed on a single screen, helping to correlate them and reducing the overall effort of analysis. But when it comes to Grafana vs. SolarWinds, which one is better? It is often difficult to choose between their dashboarding capabilities. Both tools provide their own visualizations and help bring out interactive dashboards for users to use.
Top 10 End-to-End Testing Products for Web Applications in 2023
Understanding the Rasmussen model for failures
What does the Rasmussen model teach us about Site Reliability Engineering?
How to secure your database
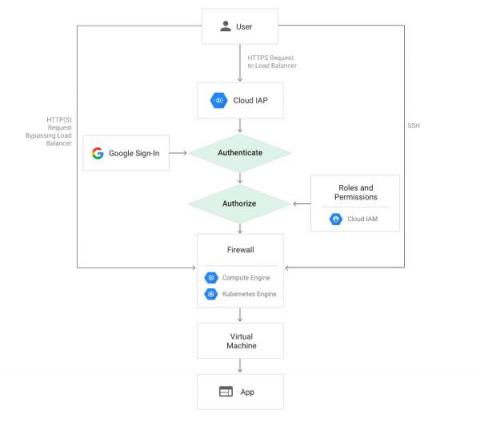
Authenticating Users with Google IAP in Rails
Google Identity-Aware Proxy (IAP) is a Google Cloud service that provides authentication for web applications. This service simplifies the process of building web applications authenticated with Google, eliminating the need to handle user-related concerns within your application code. This is especially valuable for internal applications within organizations that already utilize GSuite. It is straightforward to use, particularly when operating on Google Cloud.
Help reduce resource consumption: Put your preview environments on pause
With Platform.sh, every Git branch maps to a preview environment which is an exact and isolated copy of your live application—including all data, services, and files. They are usually created to build new features, apply security patches, or upgrade dependencies in full isolation and before deploying to production. Although there is a catch—preview environments are often left idle waiting for someone to review and approve any changes made.
The Top FP&A KPIs And How To Choose Yours
Monitoring Kubernetes with Prometheus
In part I of this blog series, we understood that monitoring a Kubernetes cluster is a challenge that we can overcome if we use the right tools. We also understood that the default Kubernetes dashboard allows us to monitor the different resources running inside our cluster, but it is very basic. We suggested some tools and platforms like cAdvisor, Kube-state-metrics, Prometheus, Grafana, Kubewatch, Jaeger, and MetricFire.


