Operations | Monitoring | ITSM | DevOps | Cloud

Latest News

Cycle.io @ KubeCon 2022: Bringing a K8s alternative to the masses!

Detroit, known by its nickname “Motor City'', is a bustling and beautiful city filled with dazzling architecture, food, history, and of course, people.This year, it was home to KubeCon 2022. The city is close to home for Jake and I, 45 minutes from where we started Cycle; it was wonderful seeing how the city has grown the last few years. The art deco style buildings loomed overhead, and the smell of freshly cooked food wafted through the downtown area just outside the venue.

New feature announcement: Introducing Automated Backups

You asked and we delivered! The days of configuring cron jobs to take backups for each of your environments are over. Soon, for every grid project, you will have your backups automated according to the plan of your choice. Meaning you can focus on deploying today without worrying about whether you can roll back to yesterday - this new feature has you covered. We thought we’d give you the heads up so you can get in there early and choose your desired backups plan.

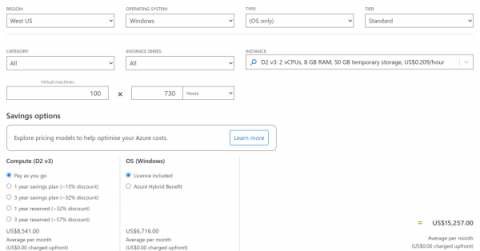
Azure pricing explained

So, you’ve decided to use Azure as your primary cloud platform and want to calculate your infrastructure costs. You estimate them based on listed prices, and rest assured that your startup/project will meet its budget. And then, suddenly, at the end of the month, you receive an invoice from Azure for an amount two times higher than you originally expected.

Managing a Slew of Monitoring Tools? Here's How to Make Them Talk.

Engineering teams use a lot of single-domain monitoring tools. In fact, the average team manages and maintains 16 monitoring tools — and up to 40 — according to Moogsoft’s State of Availability Report. While IT leaders select and implement these tools to save teams time, our research finds they do quite the opposite. Engineers spend far and away more time on monitoring than they do on any other task — innovative, value-creating tasks included.

Trending topics at KubeCon + CNC NA 2022

Throughout KubeCon + CloudNativeCon NA 2022, our team was able to speak to over 100 people from the cloud-native community to learn more about their thoughts and experience of the event. This blog will explore what the community thought was the hot topic of discussion at KubeCon + CNC NA 2022, which includes topics such as security, cost, and developer experience. Check out the full video below.

Blameless culture drives incident learning and other key insights from Catchpoint's 2022 SRE Report

SRE is a constantly evolving field, responding to the challenges of increasing reliance on tech and the opportunities of its evolving abilities. Reliability has to remain a step ahead of the cutting edge, whether it’s navigating remote work, implementing AI assistance, or optimizing internal processes. But how do we know that SRE is keeping up? ‍ We’re proud and excited to announce the results of the SRE Survey we ran in partnership with Catchpoint.

How to monitor and troubleshoot Apache web servers

The Apache HTTP Server (Apache HTTPd) is one of the most popular open source web servers available. HTTPd was also the first project developed by the Apache Software foundation which now supports hundreds of well known projects including Kafka, Cassandra and Hadoop. Netdata has a public demo space where you can explore different monitoring use-cases. Check out the Apache demo room to explore and interact with the charts and metrics described here.

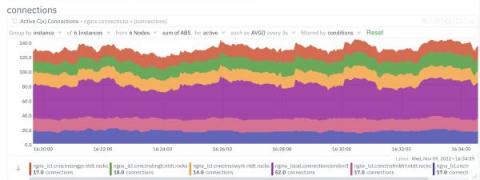
How to monitor NGINX web servers?

Web servers are among the most important components in modern IT infrastructures. They host the websites, web services, and web applications that we use on a daily basis. Social networking, media streaming, software as a service (SaaS), and other activities wouldn’t be possible without the use of web servers. And with the advent of cloud computing and the movement of more services online, web servers and their monitoring are only becoming more important.

How to Monitor Redis Performance

In this article, we are going to look at how to monitor Redis performance using Prometheus. This will allow Redis Administrators to centrally manage all of their Redis clusters without setting up any additional infrastructure for monitoring. To follow the steps in this blog, sign up for the MetricFire free trial, where you can use Graphite and Grafana directly on our platform.

Cluster Monitoring with Prometheus and Rancher

In this article, we present an overview of cluster monitoring using Rancher and Prometheus as well as provide some brief setup tutorials for both tools. We further introduce a metric visualization tool called Grafana that transforms your Prometheus time-series data into graphs and visualizations. MetricFire specializes in monitoring systems. You can use this product with minimal configuration to gain in-depth insight into your environment.