Discover the alarming truth: over 80% of users choose to suffer in silence, never reporting the tech issues they encounter. Meanwhile, many companies rely on Application Performance Monitoring (APM) tools, assuming they have a watchful eye on their systems. However, a critical blind spot persists, particularly when it comes to detecting and alerting you about problems lurking within Microsoft 365’s cloud-based applications.
Container monitoring refers to the process of monitoring and managing containers deployed within a containerization platform, such as Docker or Kubernetes. As containerization has become increasingly popular in software development and deployment, monitoring and managing containerized environments has become increasingly important.
This post was written by Joe Cozzupoli. Scroll down to read the author’s bio. As the cybersecurity landscape evolves and threats become more sophisticated, organizations need to stay ahead with the right tools and strategies to protect their valuable data. Two key technologies in this domain are Security Orchestration, Automation, and Response (SOAR) and Security Information and Event Management (SIEM).
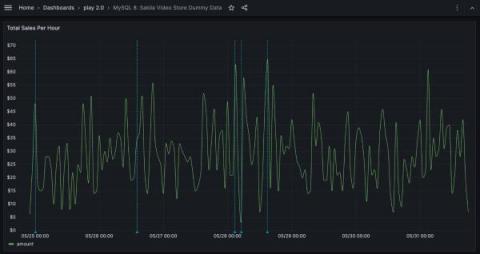
Relational databases like MySQL, PostgreSQL, Oracle, and others have a wealth of time series data locked inside of them. Often this data can be used to enhance observability dashboards, or keep track of important application factors, like how many users have signed up for a service. In this article, we’re going to show you how to visualize any time series from any SQL database in Grafana using the time series visualization.
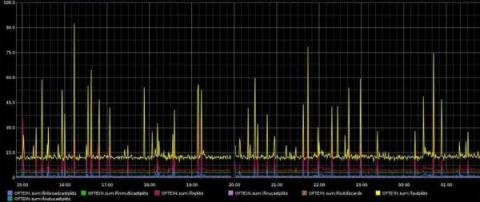
The Graphite graphing and monitoring tool is open-source software for monitoring time-series data, and it can be installed on any system, from cheap hardware to the cloud. Graphite collects time series data from infrastructure, servers, networks, and applications, and then provides the Graphite graphing UI for analyzing the data. Graphite has been around since 2008, and it has been continuously developing over the past 12 years.
Mobile device users care about three things when it comes to good app performance: We’re going to look at how modern concurrency APIs can help with some of these. We recently shipped a new profiling feature to help you find the sources of main thread contention; specifically detecting issues with image and JSON decoding or regex matching. These point you to spots where you can immediately make improvements to your app’s UI performance.