Device level monitoring is a relic of the past. Today's global IT landscape delivers services not devices and support organizations need to keep pace in an ever changing and evolving consumption driven world.
Every team has guardrails, whether you recognize them or not. They’re a form of automation that can have significant impact on your software development process and the people doing the work. They’re another way to give toil the boot and keep developers in the flow. We’ve made the case for engineering automation in a previous article; here’s how guardrails as automations ensure that agreed upon boundaries and ways of working are codified into team processes.
InfluxDB 3.0 now offers support for connecting Tableau to InfluxDB 3.0 to query data for visualization using the Apache Arrow Flight SQL JDBC driver (Flight SQL driver). In this blog post, we will explore the capabilities and benefits of this integration and provide some instructions on how to connect them.
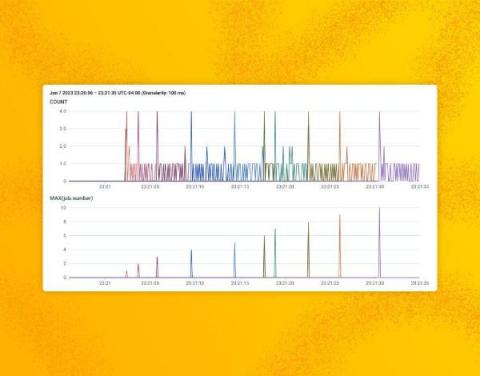
OpenTelemetry and Beelines were designed with assumptions about the types of traffic that most users would trace.
Grafana is designed to visualize data in beautiful dashboards, no matter where the information lives. However, if you are considering the hosted Grafana Cloud observability stack for visualizing your data, you might run into a roadblock: network security. The problem is that some data sources, like MySQL databases or Elasticsearch clusters, are hosted within private networks.