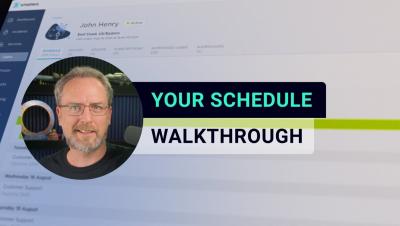
Operations | Monitoring | ITSM | DevOps | Cloud

Adaptive Alerts: Easy, actionable alerts for noisy systems

Adaptive Alerts feature provides reliable, informative, and actionable notifications about unexpected issues in monitored applications and services. Rollbar is the leading continuous code improvement platform that proactively discovers, predicts, and remediates errors with real-time AI-assisted workflows. With Rollbar, developers continually improve their code and constantly innovate rather than spending time monitoring, investigating, and debugging.

Rollbar Pro Tips: Launch Darkly Feature Flag

Enabling the Launch Darkly integration allows engineers to automate Feature Flag toggles based on errors captured in Rollbar. This means that if you ship a feature to users, only 1 user will see an error before Rollbar automatically toggles the feature flag for all subsequent users. Rollbar is the leading continuous code improvement platform that proactively discovers, predicts, and remediates errors with real-time AI-assisted workflows. With Rollbar, developers continually improve their code and constantly innovate rather than spending time monitoring, investigating, and debugging.

Zero to hero: Enterprise multi-cloud application management from Day 0 to Day 2, on any substrate

Kubernetes and Operators have stormed the IT industry, but the enterprise landscape is still a mix of bare metal, virtual machines and Kubernetes, on-prem and on public clouds, all running different workloads. How can we manage the lifecycle of all those applications across all these environments, whithout having to learn new tools and frameworks as the industry is already moving to serverless? In this fast-flowing demo we will show you how the Charmed Operator Framework brings a unified approach for application management across clouds and infrastructure generations.

Install Netdata to get started monitoring Linux in minutes

Install Netdata to monitor your Linux servers using our one-line installer. Install on physical, virtual, container, and IoT nodes. Netdata’s free, open-source monitoring agent works with Netdata Cloud to help you monitor and troubleshoot every layer of your systems to find weaknesses before they turn into outages.

How to monitor Docker containers using Netdata health and performance

Learn how to connect and claim a Docker node to start monitoring with Netdata in minutes. See information like system CPU, available memory, disk usage, total network bandwidth, and much more. Netdata’s free, open-source monitoring agent works with Netdata Cloud to help you monitor and troubleshoot every layer of your systems to find weaknesses before they turn into outages.

Learn how to build interactive dashboards with Netdata Cloud for troubleshooting systems

This video will show you how to build new dashboards with key metrics from any number of distributed systems in one place for a bird's eye view of your infrastructure. Create more meaningful visualizations for troubleshooting or keep a watchful eye on your infrastructure's most meaningful metrics without moving from node to node. Netdata’s free, open-source monitoring agent works with Netdata Cloud to help you monitor and troubleshoot every layer of your systems to find weaknesses before they turn into outages.

How to use Netdata Cloud for infrastructure observability

In this video, we cover how Netdata Cloud provides scalable infrastructure monitoring for any number of distributed nodes running the Netdata Agent. Monitor any system in your infrastructure including physical or virtual machines (VM), containers, cloud deployments, or edge / IoT devices. Netdata’s free, open-source monitoring agent works with Netdata Cloud to help you monitor and troubleshoot every layer of your systems to find weaknesses before they turn into outages.

Receive charts of Pandora FMS in Telegram

In this video we will learn how to add graphics to the alerts that we receive in Telegram for Pandora alerting. In the first tutorial we saw how to configure to receive these alerts with text and now we will be able to add that they come accompanied by the graph of the module that triggers it. We also leave you the following links to our wiki where you can learn more about the steps that make up the alerts.

Using Netdata's alerts smartboard for monitoring systems' health and performance

The alerts smartboard gives you high-level information for every node you are monitoring with Netdata Cloud. In this video, you will learn how to navigate through the alerts smartboard as well as what each alert means. Netdata’s free, open-source monitoring agent works with Netdata Cloud to help you monitor and troubleshoot every layer of your systems to find weaknesses before they turn into outages.