Operations | Monitoring | ITSM | DevOps | Cloud
Resolve Actions - Microsoft Teams Chatbot Integration
Integrating with Microsoft Teams chatbot for various activities.
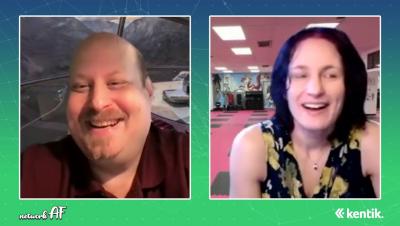
Mentorship and Shared Languages of Network Engineering with Cat Gurinsky | Network AF Episode 6
On this episode of Network AF, Avi is joined by Senior Network Engineer Cat Gurinsky to share her journey through networking. Cat found a passion for automating deployments and troubleshooting and is the current chair for the NANOG Program Committee.
DBAle 38: That's absurd! Does it even pass as database development?
It’s officially National Absurdity Day, although, this could pass as just another DBAle. In the (soya) meat of the episode, our hosts pass the time discussing the frankly absurd database development practices that are somehow still passable in 2021. While the news celebrates the PASS Data Community Summit, and the importance of passwords in data security with Troy Hunt. So, pass yourself a beer, a champers, or a Passoa, and tune in – cheers.
Solving For Multi-Cloud Visibility With OpsRamp
Join the OpsRamp team as we uncover easy ways to drive visibility and control across a hybrid, multi-cloud infrastructure landscape.
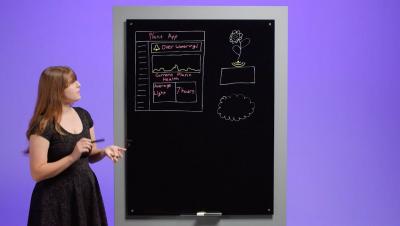
IoT Monitoring with InfluxDB
InfluxDB Developer Zoe Steinkamp discusses how to use InfluxDB and Telegraf to quickly build an IoT monitoring application.
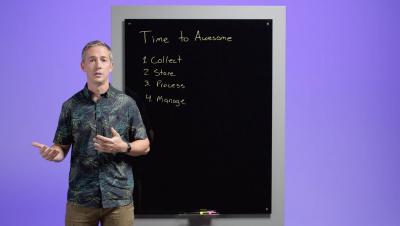
What is 'Time to Awesome'?!
InfluxData founder and CTO Paul Dix explains what 'Time to Awesome' means and why it's such an important concept for InfluxDB and developers in general.
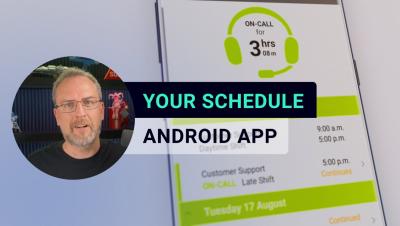
Your xMatters Schedule on Android Devices - xMatters Support
Join Chris Patch, xMatters’ Senior eLearning Specialist, as he teaches you how to view and modify your schedule in the xMatters app on Android devices.
Visualizing K8s & OpenShift CPU+Memory Risks to Performance & Cost
See how it is possible to visualize your entire Kubernetes and OpenShift deployments and see a spread of CPU and memory resource risks to your workload performance and container infrastructure costs.


