Operations | Monitoring | ITSM | DevOps | Cloud
Join Us to learn Service Mesh, Observability and Beyond
How can you scale your organization without losing an understanding of your environment? Services mesh is here to help! It gives you the observability of connected services and is easier to adopt than you might think. Come and learn service mesh concepts, best practices, and key challenges.
2021 Building an SDWAN Requirements Document and Vendor Selection
This video discusses defining key requirements (business, technical, operational, and security) in order to decide whether SD-WAN can deliver benefits to your organization. SD-WAN vendor consolidation and classification are also discussed. The requirements document should be fundamental to your SD-WAN vendor selection process. #TeneoGrp
How to monitor and optimize Core Web Vitals
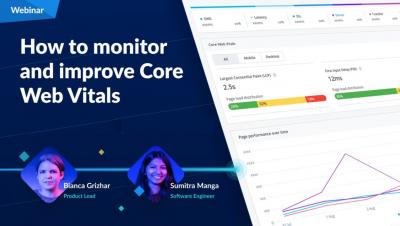
It’s game time. Core Web Vitals are here, and the majority of businesses are completely underprepared. Fortunately, this provides an opportunity to get a competitive edge for you and your business. In this webinar, our expert team will run you through the fundamentals of monitoring your Core Web Vitals and teach you actionable techniques to manage and improve your scores across your own website.
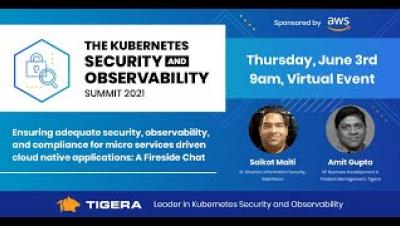
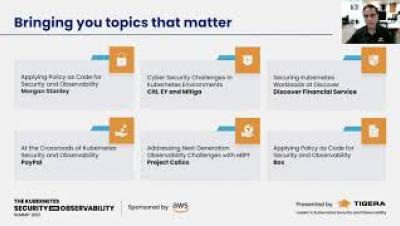
Ensuring adequate security, observability, & compliance for cloud native applications
Containers, Microservices, and cloud-based applications have revolutionized the way companies build and deliver products globally. This has also changed the attack surface and requires very different security strategies and tools to avoid exposure to sensitive information and other cyber attacks. Regulatory compliance has also evolved making it ever so important for companies to adapt to this new paradigm.
Connect SCOM to just about anywhere with an API, using Cookdown's new Connection Center
Cookdown presents their latest solution at SCOMathon 2021 - Connection Center. Connecting SCOM and anywhere with an API, using real-time two-way synchronization to automate tasks.
Pulling the Strings LIVE with James Pogran: Exploring the new PDK templating system
Today Lauren chats with James Pogran, Principal Software Engineer at Puppet, about the extremely fast, customizable, and flexible content templates.
BigPanda and xMatters Can Do What??? - xMatters Demo
Have you ever dealt with two or more separate incidents, but something about them seems suspiciously similar? Well, BigPanda and xMatters might just be the toolset you need to start connecting the dots.


