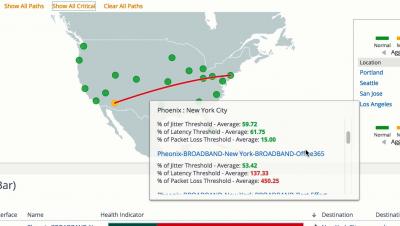
Operations | Monitoring | ITSM | DevOps | Cloud

Applying Site Reliability Engineering 'Golden Signals' to your Kubernetes Cluster

Understanding how to monitor the "Golden Signals" of Site Reliability Engineering (SRE) in your Kubernetes cluster(s) is an important skill for any engineer, especially for Day 2 Operations. Fortunately, there are some very useful, powerful, and open source tools and technologies out there for accomplishing these tasks. This training session will go over how to monitor these "Golden Signals" in a Kubernetes cluster using Prometheus and Slack.

Noah Crowley [InfluxData] | Using the Java Client Library | InfluxDays London 2019

InfluxDB 2.0 brings in support for many new client libraries. In this session, Noah will walk through how to use the new Java client library to access InfluxDB 2.0. InfluxDB comes with a new set of client libraries to allow you to insert time series data from your applications into the new InfluxDB 2.0. Specifically, Noah will share how to use the Java client library to insert data and query it in your applications.

Elastic Stack Version 7.2: Feature Tour

Elastic SIEM makes its debut. Elastic App Search introduces a self-managed downloadable deployment option. Elastic APM adds support for .NET. The new Metrics Explorer brings a more intuitive exploration of infrastructure metrics in the Infrastructure app, and Kubernetes observability story expands further with new data integrations in Beats.