Operations | Monitoring | ITSM | DevOps | Cloud

Logging

The latest News and Information on Log Management, Log Analytics and related technologies.

Elastic Observability monitors metrics for Google Cloud in just minutes

Developers and SREs choose to host their applications on Google Cloud Platform (GCP) for its reliability, speed, and ease of use. On Google Cloud, development teams are finding additional value in migrating to Kubernetes on GKE, leveraging the latest serverless options like Cloud Run, and improving traditional, tiered applications with managed services. Elastic Observability offers 16 out-of-the-box integrations for Google Cloud services with more on the way.

Understanding Log Levels

In this video, we will discuss what log levels are, how to use them in your application, and how to monitor your logs with Sematext. We break down the intricacies of log levels, guiding you through their significance and practical implementation. Elevate your DevOps game with insights on proactive issue detection and rapid problem resolution. With a centralized logging solution like Sematext Cloud, you can enhance collaboration, minimize downtime, and boost overall system performance.

Solving Complexity Challenges with Kubernetes 360

Here at Logz.io, we realize Kubernetes is the most common infrastructure component that organizations are running on to keep their applications going. In return, we’ve made a big investment to support Kubernetes properly and give customers the tools they need to investigate and troubleshoot any issues that arise.

C-suite insights on the transformative power of generative AI

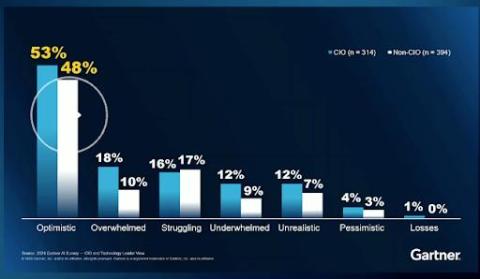
Generative AI is revolutionizing the way businesses operate, from improving operational resilience to mitigating security risks and enhancing customer experiences. In a recent roundup of c-suite insights from three IT leaders — Matt Minetola, CIO, Mandy Andress, CISO, and Rick Laner, chief customer officer — we gain a comprehensive understanding of how generative AI is being used to improve business outcomes across organizations.

Splunk Edge Hub: Physical Data, Sensing and Monitoring on the Edge

Splunk Edge Hub device is a multi-component solution that includes a hardware device coupled with the Splunk platform and solutions that our partners build on top of both. It is a powerful tool that can help collect, distribute and act on data from edge devices and sensors, making it easier to capture and act on data that can be difficult to access physically or digitally.

How SpyCloud Architected Its Cribl Stream Deployment

In this livestream, I talked to Ryan Saunders – Manager of Security Operations at SpyCloud, about how he used the Cribl Reference Architecture to build a scalable deployment. He explained how this approach enabled SpyCloud to grow alongside its evolving needs without requiring significant rework. The reference architecture also facilitated a repeatable data-onboarding process, reducing administrative time and allowing the team to focus on critical security and data analysis tasks.

Optimizing VPC Flow Logs - Part 1

Amazon Web Services (AWS) VPC Flow Logs is a feature designed to capture and provide information about the IP traffic that flows to and from network interfaces within your Virtual Private Cloud (VPC). This data can be published to various destinations, including AWS CloudWatch Logs, AWS S3, or AWS Kinesis Data Firehose. Flow logs serve several important purposes, such as diagnosing security group rule issues, monitoring incoming and outgoing traffic, and determining traffic directions.

Active vs. Passive Monitoring: What's The Difference?

Today, it’s perfectly normal for businesses to continuously monitor software applications and IT infrastructure to ensure uninterrupted customer service. Active and passive monitoring are the two popular methods enterprises use for infrastructure and application performance monitoring (APM). As the names indicate, these two approaches to monitoring are very different.