Operations | Monitoring | ITSM | DevOps | Cloud

Logging

The latest News and Information on Log Management, Log Analytics and related technologies.

Left, Right, Center: A 3 Step Dance to Success with Building Data Pipelines

Remember the first time you were at a wedding, or a party and you learned about dances like The Electric Slide? You know, those dances with a clear structure and steps to follow, which were a huge help to someone who was slightly challenged on the dance floor, like me? All you had to do was learn a few simple steps, and you could hang with even the best dancers.

Coralogix Provides Highly Scalable Traces For Your Success

While more observability vendors are providing tracing ingestion and visualization as part of their core service, only Coralogix, the leading in-stream observability platform, supports a set of data optimization features that drive down cost, maximize insights and create a scalable tracing strategy unlike others.

Cribl Stream Production Deployment Guide

Deploying new tools can be challenging for Operations and Security data teams. However, we recently released a reference architecture for Cribl Stream to streamline this process and reduce trial and error. During a live discussion, Cribl's Ed Bailey and Eugene Katz will share a real-life example of how a customer would start the deployment planning process using real-world examples. We will start with requirements and finish with a diagram to help guide a production deployment.

Connect your Lambda Function to Coralogix in 3 CLICKS

Coralogix offers a native layer for AWS Lambda functions, that allows customers to easily export telemetry data from their functions into Coralogix. This integration drastically reduces time to value and connects your lambda function to one of the most sophisticated observability platforms on the market.

Understanding Observability: The Key to Effective System Monitoring

In the rapidly evolving landscape of modern tech, system reliability has become a critical factor for businesses to succeed. To ensure the stability and performance of complex distributed systems, companies are relying on observability—a concept that isn’t synonymous, but instead goes beyond traditional monitoring approaches.

How to reindex your Elasticsearch data

The Elasticsearch reindex API copies data from one index to another. You can use reindex to change the index mapping, copy data to another cluster, or copy only a subset of data to another index. For example, suppose you want to reindex all the data in index1 into index2. In that case, you run the following example in Kibana dev tools: In this article, we dive into some common issues solved by reindexing as well as troubleshooting issues with reindexing itself.

6 easy ways to improve your log dashboards with Grafana and Grafana Loki

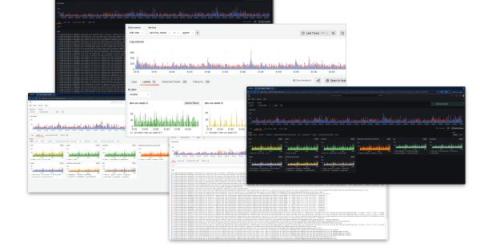
Because of where you’re reading this post, I’m going to assume you already know that Grafana is a great tool for visualizing and presenting metrics, and persisting them on dashboards. Ever since the Grafana Loki query builder for LogQL was introduced in 2022, it’s been easy to display and visualize logs, too.

Gain insights into Kubernetes errors with Elastic Observability logs and OpenAI

As we’ve shown in previous blogs, Elastic® provides a way to ingest and manage telemetry from the Kubernetes cluster and the application running on it. Elastic provides out-of-the-box dashboards to help with tracking metrics, log management and analytics, APM functionality (which also supports native OpenTelemetry), and the ability to analyze everything with AIOps features and machine learning (ML).