Operations | Monitoring | ITSM | DevOps | Cloud

The latest News and Information on Log Management, Log Analytics and related technologies.

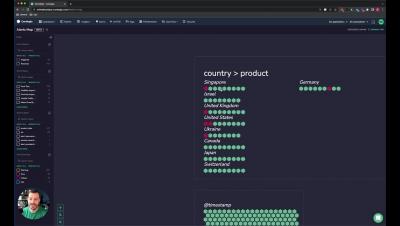
Thousands of Insights at a Glance With Coralogix Alert Map

An effective alerting strategy is the difference between reacting to an outage and stopping it before it starts. That’s why at Coralogix, we’re constantly releasing new features that redefine how alerts are consumed, to enable teams to push their ambitions even further, release with confidence, and tackle issues proactively. Alerts Map is now an indispensable tool for that mission.

Why metrics, logs, and traces aren't enough

Unlock the full potential of your observability stack with continuous profiling Identifying performance bottlenecks and wasteful computations can be a complex and challenging task, particularly in modern cloud-native environments. As the complexity of cloud-native environments increases, so does the need for effective observability solutions.

Single Vendor vs Best of Breed Solutions: A Livestream Debate on 2023 Trends

Will companies seek out best of breed solutions or stick to single vendor ecosystems. Traditionally, companies have liked dealing with vendors that could provide broad solutions to limit the number of vendors they had to deal with and make integregration easier. Companies would tolerate less than ideal tool capabilities because the strength of tools working together as a solution outweighed capability issues with any one tool. Times are changing and integration is easier than ever.

How to use Quick Actions in Sematext | Sematext Cloud Monitoring

Being able to quickly access your tools is a must for any profession. Developers need to be able to drill drown and filter through their logs in an easy manner. Simply having all the tools you need for a job doesn't truly help you much if the tools are "too far out of reach". Sematext Quick actions put the tools you use must in your hands. Quick actions allow you to easily access the tools you use most with ease. Drilling down into your logs highlighting values, creating chart, or seeing the source metrics is literally 2 clicks away. Find out how in this video.

Optimize Application Performance with Code Profiling

When monitoring your application performance or troubleshooting an issue in production, context is key. The more information available, the faster the prevention of or detection of a user impacting issue. Observability tools offer many different features, like code profiling, to help contextualize your data. In this post, I’ll discuss what code profiling is and show an example of how it works.

A Complete Guide to Google's Core Web Vitals and How to Optimize Them

The success of your website lies in how satisfied your users are with it. To help ensure the quality of your user experience, Google uses various signals from a web page. The three Core Web Vitals are some of the most important ones. In this article, I’ll talk about what each Core Web Vital means and how to optimize them to deliver a better user experience.

Logging and monitoring Kubernetes

Kubernetes is first and foremost an orchestration engine that has well-defined interfaces that allow for a wide variety of plugins and integrations to make it the industry-leading platform in the battle to run the world's workloads. From machine learning to running the applications a restaurant needs, you can see that just about everything now uses Kubernetes infrastructure. All these workloads, and the Kubernetes operator itself, produce output that is most often in the form of logs.