Micro Lesson: Cloud Infrastructure Security for AWS
Learn about Sumo Logic's Cloud Infrastructure Security for AWS, an effective way to monitor threats and suspicious activity across your entire AWS environment.


The latest News and Information on Monitoring for Websites, Applications, APIs, Infrastructure, and other technologies.
In the ever-evolving world of IT, keeping an eye on application, service and system performance and addressing issues in real-time is crucial both to an organization’s customer experience, as well as its overall success. Two terms and approaches that have gained significant attention in recent years are AIOps and observability. While they both relate to improving IT monitoring and management, they serve distinct roles in enhancing operational efficiency.
At one time, tech advancements were a major drain on small businesses. Housing your software and digital assets in-house once created a financial nightmare many emerging companies couldn't handle. On top of that, threats to security and a complete lack of flexibility made establishing a foothold challenging. That was especially true when going up against established industry heavy hitters.
To monitor and troubleshoot the performance of microservice-based applications, Jaeger and Zipkin are examples of the most commonly used open-source distributed tracing systems. They both supply users with insight into the flow of requests through various components of a system, which can be utilized to find latency bottlenecks, errors, and performance problems in the system.
Let’s be honest, working with Kubernetes (K8s) has never been the easiest tech to work with. As a seasoned Kubernetes professional, I find myself constantly looking for ways to set up collecting data from my clusters, only to find out that there is a new, more complicated way to get the data I’m looking for.
Our previous post was all about dipping your toes into the wonderful world of API interaction. By leveraging Cribl’s API you can automate many parts of your event pipeline management and tasks. So we got that goin’ for us. Which is nice. One of the common use cases for the API I hear about is kicking off data collection automatically. Use cases include: Cribl gives you the tools to collect data when you want, from where you want, and to where you want.
Enabling auto-instrumentation for your Lambda functions provides detailed insights into the performance and security of your serverless applications. Developers often also use custom instrumentation to fine-tune visibility and further tailor telemetry to their business needs. However, different teams within your organization might use a variety of instrumentation libraries, and achieving more granular visibility can come at the expense of data portability and interoperability.
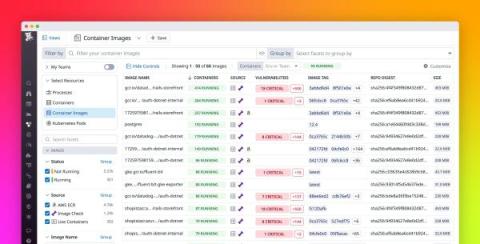
Containers are powerful tools for scaling and deploying your applications, but with so many components pulled from different sources, there’s a greater potential for issues within them to go undetected. As a result, you need to monitor every layer of your containerized environments for vulnerabilities and performance problems—from your application to your container images.