Operations | Monitoring | ITSM | DevOps | Cloud

The latest News and Information on Monitoring for Websites, Applications, APIs, Infrastructure, and other technologies.

Site24x7 Synthetic transaction monitoring using a real browser

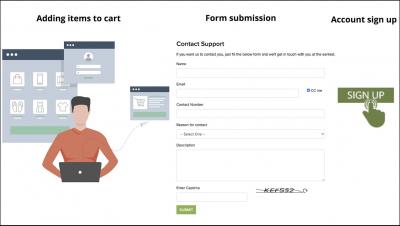
In this video, we'll show you how you can add a synthetic transaction monitor to track the performance and availability of multistep user transactions. Site24x7 offers unified cloud monitoring for DevOps and IT operations. Monitor the experience of real users accessing websites and applications from desktop and mobile devices. In-depth monitoring capabilities enable DevOps teams to monitor and troubleshoot applications, servers and network infrastructure including private and public clouds. End user experience monitoring is done from 90+ locations across the world and various wireless carriers.

The Benefit of DevOps on the Customer Experience

If there’s no customer, there’s no job. In a competitive marketplace, every site element matters from the functionality of your service to your UI; your documentation to your marketing. Your SLA should mirror that structure. Building a strong customer experience is about consistency on every level. The key is visibility, offering all the verification your customers need with an intuitive click of the mouse.

Understanding the Layers of Log Infrastructure

If you’re reading this article, you’re most likely looking for a simple one-stop-shop way to understand logs. I’m sorry to be the one to tell you this, but logs are not simple enough to deal with easily. In fact, as you start approaching this topic on a practical level you’ll quickly realize how complex and annoying it truly is.

Prometheus vs. ELK

In today’s world, with many microservices fuelling hundreds of components, the failure of just one piece can cause a crash for the whole system. For example, a lack of memory in one component can cause a database failure. This database failure could be the reason for authentication problems for particular users, causing those users to not be able to login. And of course, finding the core problem manually can be complex and time-consuming.

Application Performance Monitoring (APM) for HTTP URLs

Since its beginning, Obkio's solution focused on Network Monitoring with the Network Performance Monitoring and Network Device Monitoring feature sets. With these features, IT teams can monitor and troubleshoot intermittent network issues with precise network metrics including some Quality of Experience (QoE) metrics based VoIP Quality and MOS Score.

7 Tips to Make Digital Performance Monitoring More Effective

A poorly performing website or web application hurts the end-user experience and can result in lost revenue and customers. That’s why businesses seek better tools and processes to simplify digital performance monitoring to expedite detection and troubleshooting of performance issues. There are numerous website performance and availability monitoring tools available for this purpose.

BGP Monitoring with Network Insights

In this week’s tip, we are looking at a use case unique to our popular Network Insights solution. Network Insights lets our users view their network path from end to end, providing detailed granular telemetry from four primary sources: We could go into depth on any of these, but today we’re going to focus on Border Gateway Protocol (BGP) Monitoring.

Icinga for Windows: MSSQL Plugin Release v1.0.0

Today we are happy to announce that our MSSQL plugins for Icinga for Windows are enhancing the series of Icinga plugins and become released as version 1.0. With this first release we are sharing four plugins to check the current health of MSSQL itself but also internal metrics. In addition we provide a plugin to fetch MSSQL specific Performance Counters from within the database, similar to our Windows Performance Counter plugin and a backup check plugin.