Operations | Monitoring | ITSM | DevOps | Cloud
The latest News and Information on Observabilty for complex systems and related technologies.
How To: Connecting Azure Blob to Cribl Stream to Replay Observability Data
One of the core features of Cribl Stream is our Replay capability. We pride ourselves on giving customers choice and control over their data. The ability to archive data in cheap object storage, and then providing the ability to reach into the same object storage is one example of this. It’s safe to say that S3 and AWS have become synonymous with the term object storage. It’s like a modern day Kleenex, or Band-Aid.
Key Observability Scaling Requirements for Your Next Game Launch: Part I
After months–or potentially, years–of hard work by teams across a gaming enterprise, when the day arrives for a game launch, the last thing your enterprise needs is slowdowns, glitches, outages or poor performance. It’s the death knell for any game, because for your avid gaming customers, there’s always something else (read: a game that isn’t yours) to check out.
Part 3: Observability - Level 2
An organization at Level 2 in the Observability Maturity Model has built on the foundation of their monitoring capabilities and taken the first steps into observability. In recent years, two major trends have driven the need for the deeper insights that observability can provide.
What is AIOps? A beginner's guide
Artificial Intelligence for IT Operations (or AIOps for short) continues to be a hot topic among developers, SREs, and DevOps professionals. The case for AIOps is especially crucial given the expansive nature of today’s observability efforts across hybrid and multi-cloud environments. As with most observability platforms, it all starts with your telemetry data: metrics, logs, traces, and events.
Which is More Important: Observability or AIOps?
In the last half-decade, AIOps and observability have arguably been the hottest two topics in IT operations management. Gartner first mentioned AIOps—Artificial Intelligence for IT Operations—in 2016, defining it as using big data and machine learning to automate IT operations processes, such as event correlation, anomaly detection and causality determination.
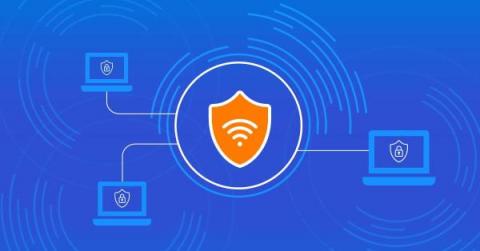
8 reasons why network observability is critical for DDoS detection and mitigation
Distributed denial-of-service (DDoS) attacks have been a continuous threat since the advent of the commercial internet. The struggle between security experts and DDoS protection is an asymmetrical war where $30 attacks can jeopardize millions of dollars for companies in downtime and breaches of contract. They can also be a smokescreen for something worse, such as the infiltration of malware.
Running the OpenTelemetry Collector in Azure Container Apps
In this post, we’ll look at how to host the OpenTelemetry Collector in Azure Container Apps. There are a few gotchas with how it’s deployed, so hopefully this will stop you from hitting the same issues. If you don’t care about the details and just want to run a script, I’ve created one here.
Database Decision-Making for Observability, from Simple to Complex
A goal of open-source observability is unifying several different signals to provide the observability everyone wants. It’s always interesting to speak to people on this journey, and how they try to provide it through open-source projects, and the challenges they can face. I was thrilled to host Pranay Prateek on the most recent episode of the OpenObservability Talks podcast.
Observability During Development
Observability During Development with Honeycomb - https://www.honeycomb.io/
Learn about incident management: https://bit.ly/376J9V7
Subscribe to PagerDuty's channel: https://bit.ly/3BNQYNS


