Operations | Monitoring | ITSM | DevOps | Cloud

Product Release Notes March 2024

Access to critical business data, such as cloud cost data, is both incredibly important for finance, engineering, and DevOps teams, but also a privilege that should be managed carefully. This month, our engineering teams put a major focus on developing industry-leading capabilities related to access control, while also making it easier for people who require certain kinds of data to get it where it needs to be.


Elastic Universal Profiling agent, a continuous profiling solution, is now open source

Elastic Universal Profiling™ agent is now open source! The industry’s most advanced fleetwide continuous profiling solution empowers users to identify performance bottlenecks, reduce cloud spend, and minimize their carbon footprint. This post explores the history of the agent, its move to open source, and its future integration with OpenTelemetry.

NLP vs. LLMs: Understanding the differences

As AI continues to grow and solve problems across countless industries, a key part of that tech is the ability to seamlessly bridge the gap between human language and machine understanding. This is where natural language processing (NLP) and large language models (LLMs) come in. They provide distinct and specialized approaches for connecting the power of human communication with software and machines. Or in simpler terms, NLP and LLMs enable us to have human-like conversations with software.

Azure Storage Updates FY24

In today’s fast-evolving digital landscape, the importance of robust and scalable cloud storage solutions cannot be overstated. Enterprises across the globe are increasingly leveraging cloud technologies to drive innovation, streamline operations, and reduce costs. Microsoft Azure, as a leading provider of cloud services, continues to enhance its storage solutions to meet the diverse and growing needs of its users.

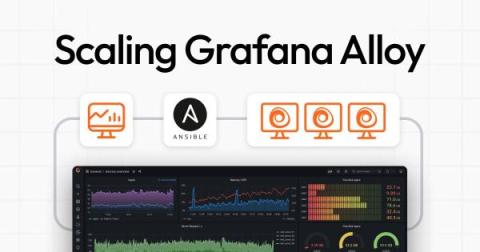
A guide to scaling Grafana Alloy deployments across multiple hosts

Last week we introduced Grafana Alloy, our distribution of the OpenTelemetry Collector with built-in Prometheus pipelines and support for metrics, logs, traces, and profiles. We’re excited to see the community embrace Alloy, and we want to help them use and scale it as easily as possible. Many developers that need to deploy and manage software across several hosts turn to Ansible for its ease of use and versatility.

Structure of Logs (Part 1) | Zero to Hero: Loki | Grafana

Have you just discovered Grafana Loki? Zero to Hero: Loki is a series of videos that aims to take you through the basics of ingesting, your logs into Grafana Loki an open-source log aggregation solution. In this episode, it's all about the structure of logs. In part 1 we cover what components make up a log entry. ☁️ Grafana Cloud is the easiest way to get started with Grafana dashboards, metrics, logs, and traces. Our forever-free tier includes access to 10k metrics, 50GB logs, 50GB traces and more. We also have plans for every use case.

GrafanaCON 2024 Keynote: Grafana 11, Loki 3.0, Alloy, Golden Grot Awards, and more | Grafana

During GrafanaCON 2024, we came back together in person for the first time since 2019. Grafana Labs CEO and Co-founder Raj Dutt announced the winners of the Golden Grot community dashboard awards, and members of our engineering team made some exciting announcements around our open source observability projects including Loki 3.0 and Alloy. And Torkel Ödegaard, the creator of Grafana, unveiled what’s new in Grafana 11, with some demos.

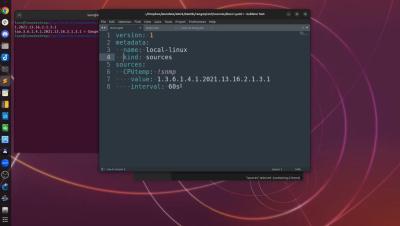
How to Configure Kentik NMS to Collect Custom SNMP Metrics

Join Kentik's Leon Adato as he explains how to customize Kentik's NMS (Network Monitoring System) to collect specific SNMP metrics not covered by default settings. Learn how to add custom SNMP elements, navigate YAML configurations, and organize your data for clarity. With practical steps and a linked blog for detailed guidance, this video empowers you to enhance your network observability in Kentik NMS. Ideal for those looking to tailor their monitoring setup without getting lost in complexity.

Discover Splunk - the unparalleled, most comprehensive full-stack observability solution

How do you become digitally resilient as an organisation? Hear from Maria Nyström, Regional Sales Manager at Splunk Sweden, about how Splunk is helping enterprises get full traceability in their environment. Splunk customers can trace any issue for any user and follow that to the application backend, the specific microservice and the infrastructure it runs on.