Operations | Monitoring | ITSM | DevOps | Cloud
%term
Real User Monitoring vs. synthetic monitoring: 11 key differences
If you’re looking to learn the differences between Real User Monitoring (RUM) and synthetic monitoring, keep reading. We’ve outlined 11 key differences, but maybe we should say 11 key ways the two complement each other.
Why you need an off-site StatusKeeper Status Page
Raygun and Java: Better error monitoring with Breadcrumbs and more
Raygun Crash Reporting has supported the Java Framework since we launched. As a Java customer, you’ve always been able to catch errors pre and post-production, receive alerts, and provide one source of truth for errors on your whole team. Now, Raygun provides full feature support for Raygun4Java. Java customers now have access to all our favorite Raygun features, like Breadcrumbs, offline support, web service support, and sensitive data filtering.
Get your sheet together: how to create an incident communication plan
Downtime happens. While it can certainly be chaotic and stressful, if handled properly, it can also be a chance to build customer trust and loyalty. The way you respond to and communicate around incidents and downtime tells customers a lot about what you value. Therefore, it’s essential to show customers you value them by communicating early, often, and candidly during an incident.
New Relic Integration
August 2018 Online Meetup: Building a CI/CD Pipeline with Kubernetes and Rancher 2 0
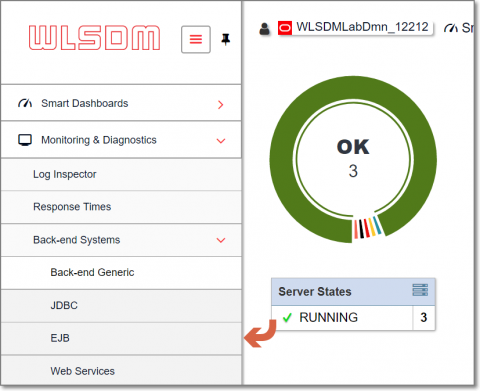
How to monitor JavaEE applications' EJB method performance on WebLogic?
Previously on WLSDM blog, we have learned about monitoring applications’ database statements (JDBC SQL) and performance on Oracle WebLogic server. In this blog post we have created another tutorial to learn how to monitor and diagnose WLSDM back-end EJB business method invocation events.
Set Up for Success: Service Taxonomies in PagerDuty
It’s 2:37 a.m. on a Tuesday night, you’re asleep—but it’s also your turn to be on call. You receive a phone call from PagerDuty. Your partner hits you with a pillow in an attempt to wake you up. It worked. You groggily answer the call and hear your favorite robo-guy on the other end of the line.
Share Context With Collaboration: Suggested Query Boards
Nobody knows your services/infra better than you, not even Honeycomb. If there’s one maxim for Honeycomb, it’s that context is king. Context determines the questions you can ask. The only way to make complex systems truly tractable is to make all questions possible. Ergo: more context. Context everywhere. Context coming out of the walls. You should be awash in context.


