Operations | Monitoring | ITSM | DevOps | Cloud

%term

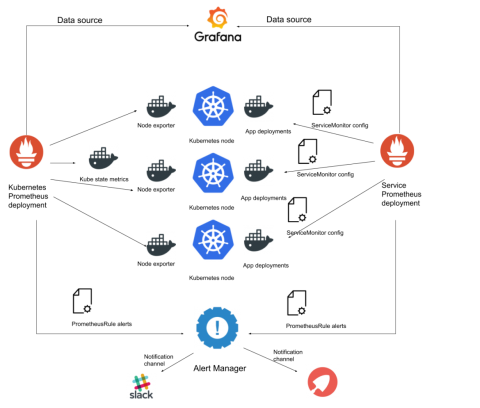
Kubernetes monitoring with Prometheus - Prometheus operator tutorial (part 3).

We covered how to install a complete ‘Kubernetes monitoring with Prometheus’ stack in the previous chapters of this guide. But using the Prometheus Operator framework and its Custom Resource Definitions has significant advantages over manually adding metric targets and service providers, which can become cumbersome for large deployments and doesn’t fully utilize Kubernetes’ orchestrator capabilities.

How IT Pros Can Maximize Efficiency With Uptime.com

IT professionals have to efficiently manage several dozen to several hundred critical pieces of infrastructure a modern business needs to stay afloat. Even smaller businesses often encounter this challenge. We understand that at every level, the time spent researching these issues comes at a cost. That’s why we’ve built some time-saving measures into Uptime.com to help you make more efficient use of your most precious resource: your time.

Monitoring Kafka in Production

Franz Kafka was a German-speaking Bohemian Jewish novelist and short story writer, widely regarded as one of the major figures of 20th-century literature. Apache Kafka, on the other hand, is an open-source stream-processing software platform. Due to its widespread integration into enterprise-level infrastructures, monitoring Kafka performance at scale has become an increasingly important issue.

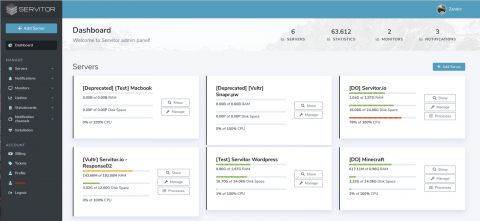
Get started with server monitoring using Servitor.io

This guide will get you started with Servitor.io, how to setup your monitoring for your server. Since you are reading this I’m going to assume you made an account and are ready to rock! If you, click here to register one and continue. After registering you will be redirected to the dashboard.