Operations | Monitoring | ITSM | DevOps | Cloud

Monitoring, Observability, & Debuggability Explained

Monitoring tools are great at letting you know when something is broken and the overall impact. We should know, we make an error monitoring tool. Observability tools are good for well, observing. But here’s the thing, you (we) don’t observe code. We (you) push code. So what the collective “we” need is a tool that makes it easy to ship, improve, and maintain reliable and performant code.

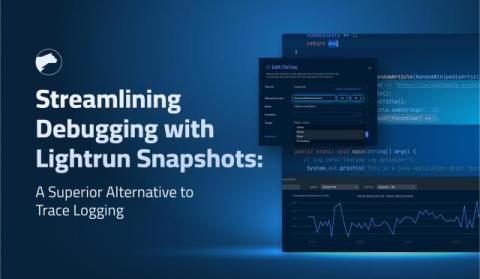
Streamlining Debugging with Lightrun Snapshots: A Superior Alternative to Trace Logging

According to a recent study, failing tests alone cost the enterprise software market an astonishing $61 billion annually. This figure mirrors the vast number of resources devoted to rectifying software failures, translating into about 620 million developer hours lost each year. On average, engineers spend 13 hours to resolve a single software failure, a statistic that paints a stark picture of the current state of debugging efficiency.

A Schematic Review Checklist for Firmware Engineers

Schematic reviews are a part of the hardware development cycle in many if not most, hardware development companies. Typically led by the electrical engineering team, it is easy to overlook design issues that will be important to the firmware team. This post tells of a few stories of design misses that I have made and puts some common lessons learned into a checklist for other firmware engineers.

Debugging slow pages caused by slow backends

As a developer, what should your reaction be when someone says your website is slow to load? As long as you don’t say, “I just let my users deal with it”, you’re already on the right track. Since you’ve chosen to relieve some user suffering, I’m here to help guide you through the process of identifying and fixing those slow loads and performance issues.

Inside Look: How Sentry debugs with Sentry

Join Sentry engineer Yagiz Nizipli as he shares how he uses Sentry to fix Sentry. In this session, he’ll demo how he identified and optimized critical pipeline tasks, saving $160,000 per year. The improvements he made, including caching, improving traffic distribution, and enabling background threads Throughout the workshop, Yagiz will also share tips and best practices for using Tracing to uncover performance bottlenecks and drive continuous improvement across our own services.

Debug Third-Party APIs with Requests

The internet is basically just a bunch of websites calling each other. You make a call to some service, that service calls you back, and then that service goes down and ruins your afternoon. Requests, our latest addition to Insights, is a place to see, understand, track, and improve the behavior of outgoing HTTP requests.