Operations | Monitoring | ITSM | DevOps | Cloud

Effective Profiling in Google Chrome

This blog post will explain how to effectively profile your website so that you can deal with performance pain points. We’ll go through the two most used tools in Google Chrome for profiling: Imagine that you optimized your backend and everything is running smoothly. However, for some reason, the load time of your pages is still unreasonably high. Your users might be experiencing sluggish UI and long load times. This post will help you sort these issues out.

New debugging superpowers with Discover

Sentry makes it pretty easy to connect a customer-facing issue right to the line of code, the release, and even the commit that caused it. At least that’s what developers tell us on Twitter. But you’re rarely working with obvious errors or errors affecting just one user. That’s why we added some new features to Discover and made diagnosing root causes even easier.

Introducing always-on production profiling in Datadog

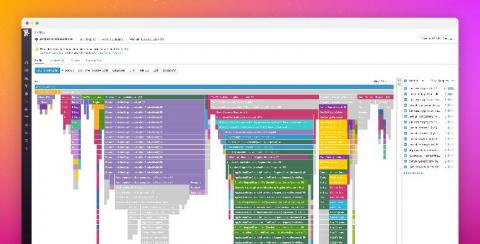
To complement distributed tracing, runtime metrics, log analytics, synthetic testing, and real user monitoring, we’ve made another addition to the application developer’s toolkit to make troubleshooting performance issues even faster and simpler. Today, we’re excited to introduce Profiling—an always-on, production profiler that enables you to continuously analyze code-level performance across your entire environment, with minimal overhead.

Debugging a Segfault in Rust

In case you missed our pair programming session about how to run, crash, and debug a Native application using Sentry, worry not! Our artificial intelligence Richard — much more intelligent than it thinks — has used its special powers to upload a recording of our session. This time, we chose a very special victim: Symbolicator. That’s the service responsible at Sentry for processing native crash reports.

Powerful Ignore Rules for Noisy JavaScript Errors

Ignoring noisy and external errors is important to understanding the health of your client-side applications. Third-party scripts, user extensions, content crawlers, and non-impactful errors create lots of noise in web operations. With TrackJS Ignore Rules, you can filter out this noise and and have a clear view of your web application quality.