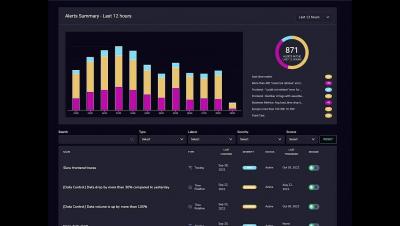
Every millisecond, humans generate significant volumes of data, from various IoT devices such as our wearable devices to daily activities such as internet surfing and tracking our workouts. Data continues to accumulate. Statista estimates that by 2025, the amount of data will have increased to 180 zettabytes. That's far too much information.
Monitoring is an integral part of most organizations. The monitoring process usually consists of several tools that, combined, show you information about whatever you're monitoring - applications, infrastructure, networks and so forth. While monitoring may seem like an obvious practice to some, it can be challenging to establish the best monitoring strategy for your organization.
In a world of monolithic applications and microservices, responding to incidents can be a painful process, involving multiple people with siloed knowledge jumping between different tools to find the relevant data and take action. Individuals within a business often hold the knowledge of how a particular component works, or how it depends on other services. The key to successfully responding to incidents is unlocking this knowledge and breaking down the silos between teams.
The following guest post addresses how to improve your services’ performance with Sentry and other application profilers for Unity. Learn more about Sentry’s Profiling product or try it out now if you’re already a Sentry user. We’re making intentional investments in performance monitoring to give relevant context to help you solve what’s urgent faster.
September included five new NinjaOne releases and hotfixes, providing a variety of new features and capabilities across scripting, documentation, ticketing, and more. Let's dive in.