Operations | Monitoring | ITSM | DevOps | Cloud

Mastering NodeJS Performance Monitoring - A Practical Guide using Open Source Tools

Node.js powers some of the fastest-growing web applications, but its single-threaded nature makes it vulnerable to memory leaks and CPU spikes. To keep your app running smoothly, especially in production, you need more than just web server logs — you need complete visibility across the entire stack.
How to Collect .NET Application Logs with OpenTelemetry

Observability is essential for maintaining and scaling modern applications. With.NET 8, Microsoft has enhanced support for observability using OpenTelemetry. In this post, we explore how to monitor.NET 8 applications logs with SigNoz, an open-source observability platform, using the OpenTelemetry Protocol (OTLP) exporter.

Monitoring Backstage with OpenTelemetry:Closing the observability blind spot

‘One small step for a man, but a huge leap for developers’ — me, when I realised how to observe my Backstage with OpenTelemetry. Backstage is often the “portal” through which we manage all our other systems, but who watches the watcher? Recently, we gave a KubeCon Talk, highlighting that monitoring Backstage itself is critical. When Backstage isn’t observable, it becomes a blind spot in your infrastructure.

SigNoz Community Edition now available with SSO (Google OAuth) and API Keys

One of the biggest asks from our open-source community has been to open-source our SSO support, which was part of our enterprise offering. Today, we’re thrilled to announce that support for SSO with Google OAuth is now part of our latest release. Latest version: v0.85.0 Not only that, we've also shipped another highly anticipated feature for our Community Edition: API Keys for comprehensive programmatic access to SigNoz.

Shedding Light on Kafka's Black Box Problem (with OpenTelemetry)

"All language is but a poor translation." — Franz Kafka This quote by Franz Kafka reminds me of the time when I used to look at metrics from “Apache Kafka” topics trying to figure out what was causing the huge lags and manually deleting the messages in certain partitions to get rid of polluted messages. Yep, pretty lost in translation. I wasn’t aware of the power of observability for a Kafka producer-topic-consumer system.

SigNoz Launch Week 4.0 - OpenTelemetry Powered Innovations That Redefine Observability

OpenTelemetry is rapidly becoming the backbone of modern observability, but true innovation happens when you build directly on its latest capabilities. For Launch Week 4.0, we’re excited to showcase five powerful features; each crafted to help you get more value from your telemetry, make debugging faster, and deliver a unified observability experience. Here’s a quick look at what’s new, why it matters, and how SigNoz is pushing the boundaries of what’s possible with OTel.

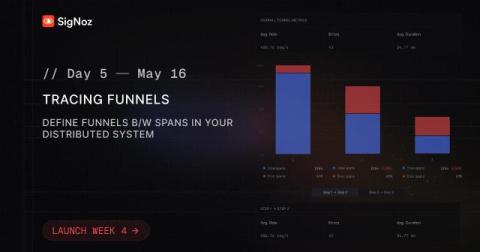
Tracing Funnels - Define funnels between spans | SigNoz Launch Week 4.0 Day 5

Build funnels directly on your traces and get instant answers to questions like: What fraction of spans made it from event A to event B? Between which spans are most requests failing? What is the latency between key spans? Traditional observability tools let you inspect traces and spans, but they can’t aggregate or analyze how requests flow across multiple services or stages in your system. In asynchronous, distributed architectures, the root span rarely tells the full story-and there’s no way to measure conversion, drop-off, or latency between arbitrary steps across all traces.

Tracing Funnels - Define funnels b/w spans in your distributed systems

Distributed tracing has long been the go-to for understanding the performance of microservices and asynchronous systems. But as systems grow in complexity, simply viewing individual traces and spans isn’t enough. Teams need to answer questions like: SigNoz Tracing Funnels is here to change that, bringing the clarity of product analytics-style funnel analysis to backend traces, and doing so in a way that’s never been available before.

CI/CD Observability Powered by OpenTelemetry | SigNoz Launch Week 4.0 Day 4

Tired of guessing why your releases stall, which PRs are stuck, or where flaky tests are wasting your team’s time? Most teams obsess over production monitoring, but what about the bottlenecks that often hide in the CI/CD pipeline slowing delivery, draining productivity, and introducing risk before code ever ships. With CI/CD Observability, you can: So, stop flying blind in your delivery process and make every release faster, more reliable, and fully transparent!

CI/CD Observability Powered by OpenTelemetry

Modern engineering teams spend a lot of time and resources in setting up monitoring of their production systems - tracking uptime, catching errors, and responding to incidents before customers ever notice. But what about the journey before code reaches production? For most teams, observing the CI/CD pipeline is either an afterthought or completely overlooked. While we recognize its importance, do we truly understand how well our CI/CD process is functioning?