Operations | Monitoring | ITSM | DevOps | Cloud
Dashboards
Organize Your Custom Dashboards More Easily in AppSignal
We're happy to announce that we've added a feature that will enable you to create folders for your custom metric dashboards.
How to publish messages through Kafka to Grafana Loki
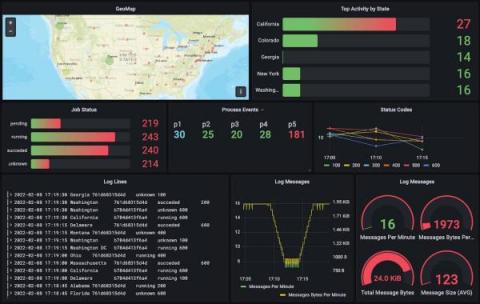
Back in November 2021, Grafana Labs released version 2.4 of Grafana Loki. One of the new features it included was a Promtail Kafka Consumer that can easily ingest messages out of Kafka and into Loki for storing, querying, and visualization. Kafka has always been an important technology for distributed streaming data architectures, so I wanted to share a working example of how to use it to help you get started.
SquaredUp 5.4: New Surface image tile
We just released the new SquaredUp 5.4 with some brilliant new features. Headlining as the two biggest updates were the new ODBC data source and a new visualization – the Surface image tile. The Surface tile lets you build stunning dashboards with any image.
How secure is your Grafana instance? What you need to know
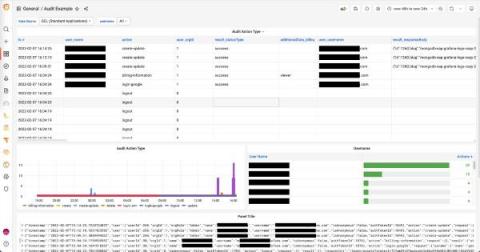
One of Grafana’s most powerful features is the ability to funnel data from hundreds of different data sources (i.e., services or databases) into a single dashboard without migrating the data from where it lives. You can connect and correlate data from Grafana’s curated observability stack for metrics, logs, and traces, or third-party services, such as Splunk, Elasticsearch, Github, Jira, and many more.
Dashboard Fridays: Sample SQL Page Timeframe dashboard
SquaredUp 5.4: New ODBC data source
We just released the new SquaredUp 5.4 with some brilliant new features. Taking center stage was the new ODBC data source. (If you missed the release announcement you can catch up by reading the quick overview blog post where you can also watch the full release webinar.) With SquaredUp 5.4, you can now instantly visualize any data from almost any database with the addition of ODBC.
SCOM 2022 coming soon: the most exciting updates
Great news for the SCOM community – SCOM 2022 is going to be released in the spring! SCOM isn’t going anywhere and it’s only getting better. We saw this proven in the Big SCOM Survey Results 2021 where more than half of respondents said they were going to increase their SCOM deployment to monitor more of their existing and new infrastructure.


