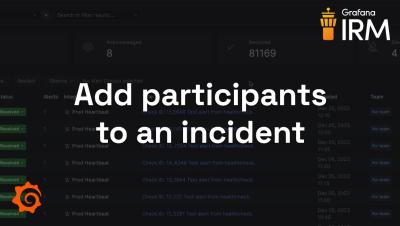
Operations | Monitoring | ITSM | DevOps | Cloud

The Grafana OpenTelemetry Distribution for .NET: Optimized for Application Observability

The OpenTelemetry project provides many different components and instrumentations that support different languages and telemetry signals. However, new users often find it hard to pick the right ones and configure them properly for their specific use cases. For this reason, OpenTelemetry defines the concept of a distribution, which is a tailored and customized version of OpenTelemetry components. Here at Grafana Labs, we are all-in on OpenTelemetry.

Transform Your Kubernetes Troubleshooting With Powerful Data Correlations

As developers and engineers, we're all too familiar with the manual labor of connecting disparate data points—metrics, logs, events and resource status. We're also familiar with a continual need to simplify and unify these elements into a seamless troubleshooting experience. This on-demand webinar looks at how data correlation approach provides a holistic view of complex system interactions and can move you from issue awareness to full resolution without juggling different tools or performing mental gymnastics. All on a single dashboard!

Dashboarding Azure Monitor SCOM MI in SquaredUp

Big news! Microsoft have just dropped Azure Monitor SCOM Managed Instance (SCOM MI), their cloud-based alternative to SCOM. It’s fully Microsoft managed, and so it promises to take the headache out of deploying, scaling, and managing your SCOM Management Groups. Read Microsoft’s announcement blog to learn all about it.

What is DevOps? Grafana for Beginners Ep.2

As a beginner in DevOps, you probably have come across multiple definitions of DevOps and countless things that fall under the DevOps umbrella. So you have a basic idea of what DevOps is but are you able to explain it to another newbie like yourself? Join Lisa Jung, a senior developer advocate at Grafana, to learn about DevOps in the simplest terms possible. Subscribe to the Grafana for Beginners series to delve deeper into concepts like observability, DevOps, and how Grafana can be used to observe your system as a part of your DevOps Practice!

Set and scale service level objectives in Grafana Cloud: Introducing Grafana SLO

When we began offering Grafana Cloud Metrics, we set a service level agreement (SLA) for 99.5% of requests to be completed within a few seconds. So we built an alert that would go off if more than 0.5% of requests were slower than a couple of seconds within a five-minute moving window. Sounds reasonable, right?

Manage log volumes, metrics cardinality, monthly bills: Explore Grafana Cloud cost management tools

As more organizations adopt observability at massive scale, they have also been grappling with rising costs. Over the past 12 months, we have been working on different solutions to help our users better understand and manage their observability stack, not to mention the bills that come with scaling it.

Grafana Beyla 1.0 release: zero-code instrumentation for application telemetry using eBPF

Just two months after introducing the public preview of Grafana Beyla, we are excited to announce the general availability of the open source project with the release of Grafana Beyla 1.0 at ObservabilityCON 2023 today. We’ve worked hard in the last two months to stabilize, stress test, and refine the features that were part of the public preview of this open source eBPF auto-instrumentation tool.

How Asserts.ai will make it even easier for Grafana Cloud users to understand their observability data

At Grafana Labs, our mission has always been to help our users and customers understand the behavior of their applications and services. Over the past two years, the biggest needs we’ve heard from our customers have been to make it easier to understand their observability data, to extend observability into the application layer, and to get deeper, contextualized analytics.

Announcing Application Observability in Grafana Cloud, with native support for OpenTelemetry and Prometheus

The Grafana LGTM Stack (Loki for logs, Grafana for visualization, Tempo for traces, and Mimir for metrics) offers the freedom and flexibility for monitoring application performance. But we’ve also heard from many of our users and customers that you need a solution that makes it easier and faster to get started with application monitoring.