Operations | Monitoring | ITSM | DevOps | Cloud
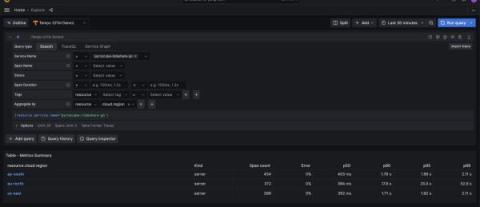
Traces to metrics: Ad hoc RED metrics in Grafana Tempo with 'Aggregate by'
In observability, finding the root cause of a problem is sometimes likened to finding a needle in a haystack. Considering that the problem might be visible in only a tiny fraction of millions or billions of individual traces, the task of reviewing enough traces to find the right one is daunting and often ends in failure.
Combining AWS and Prometheus with OpenTelemetry
In the realm of data and complex scenarios, we humans naturally gravitate towards visualizing things as entities with attributes, rather than just raw data. Consider the phrase, “The response time on our Ad Generation service has increased.” It immediately resonates with the audience supporting the service.
The case for Kubernetes resource limits: predictability vs. efficiency
This blog post by Grafana Labs Senior Software Engineer Milan Plžík was originally published on the Kubernetes.io blog on Nov. 16, 2023. There’s been quite a lot of posts suggesting that not using Kubernetes resource limits might be a fairly useful thing (for example, For the Love of God, Stop Using CPU Limits on Kubernetes or Kubernetes: Make your services faster by removing CPU limits ).
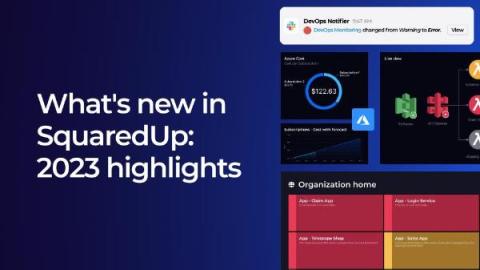
What's new in SquaredUp: 2023 June - Dec highlights
As 2023 draws to a close, we’re celebrating a full year since the release of SquaredUp Cloud – our revolutionary observability portal for product, engineering, and IT teams. In the last six months, we’ve packed in a ton of product improvements, including new visualizations, even more out-of-the-box dashboards, and a fast growing suite of pre-built plugins.
'The Story of Grafana' documentary: Celebrating OSS, community, and innovation
On Dec. 5, 2013, Torkel Ödegaard made the first commit in GitHub for a personal project that would become Grafana. “It’s hard to believe it’s been 10 years since Torkel launched Grafana, growing from a small man with a big dream to becoming the most popular data visualization software in the world,” says Grafana Labs co-founder and CEO Raj Dutt. “The Story of Grafana” chronicles that meteoric journey.
The Story of Grafana | Episode 1: Democratize Metrics | Grafana Documentary
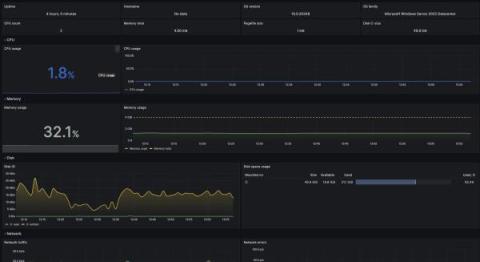
Monitoring Microsoft Windows with Grafana Cloud: new updates
Windows is widely used by developers, businesses, and individuals alike. Renowned for its adaptability, security, and reliability, the operating system is a preferred choice for servers, desktops, and embedded devices. It also holds a significant presence in the cloud, serving as the foundation for numerous major websites and applications.
ELI5 Distributed tracing #observability #tracing #tempo
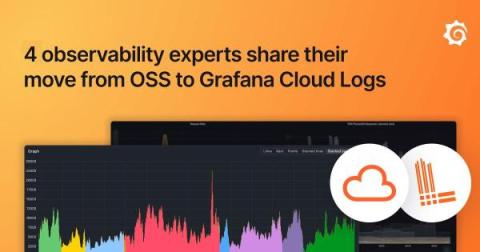
Log management with Grafana Cloud: 4 observability experts share their move from OSS to Grafana Cloud Logs
While we built Grafana Loki as an open source log aggregation system that is cost effective and easy to operate, let’s face it: sometimes there is no time or bandwidth to mess around with self-managing and self-hosting. Luckily there’s the fully managed Grafana Cloud observability stack for log management. “Grafana Cloud is a no-BS platform. The engineering costs of hosting it ourselves would be much higher," says Jameel Al-Aziz, a software architect at Paradigm.


