Operations | Monitoring | ITSM | DevOps | Cloud
eBPF in 1 minute
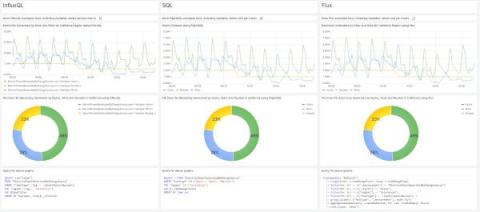
A comparison of InfluxQL, SQL, and Flux query languages for Grafana dashboards
Grant Pinkos manages two businesses near Detroit, Michigan. He enjoys Industrial IoT, Industry 4.0, guitar solos, and Pomeranians, and holds a BS in engineering and an MBA. Grant is a Grafana Champion and is very active in community discussions. He has also presented at GrafanaCON and authored a tutorial.
The concise guide to Loki: How to get the most out of your query performance
Thanks for joining me for Part 3 of “The concise guide to Grafana Loki,” a series of blog posts that takes a closer look at best practices for various aspects of using the log aggregation system. Today’s post is my holiday present for all the folks out there running Loki who would like to get the most query performance they can out of their cluster.
How to integrate Grafana Alerting and Telegram
Grafana Alerting helps you identify issues almost immediately after they occur — and you don’t have to constantly check your system to get the insights you need. Instead, Grafana Alerting sends alert notifications to reach you wherever you are, whether that’s in a Slack channel or in a messaging app like Telegram. Telegram is a viable option for receiving alerts, especially when you want personal or individual notifications rather than those sent to a team.
Grafana dashboards in 2023: Memorable use cases of the year
As the number of Grafana users grows each year, so does the variety of reasons people are using Grafana dashboards. During 2023, members of the our community — both inside and outside of the company — shared some of their incredible professional and personal projects, including how Grafana has allowed them to successfully launch a rocket, cut back on carbon emissions, and even help balance a national power grid.
Grafana Cloud 2023: Year in review
Open source is the foundation of everything we do here at Grafana Labs, and that was on full display this year as we celebrated the 10th anniversary of Grafana and continued to improve and expand our lineup of OSS projects. But 2023 was also a banner year for Grafana Cloud, as more organizations than ever turned to the fully managed stack to carry out their observability strategies more easily and quickly.
What is Open Telemetry?
Open source at Grafana Labs in 2023: Year in review
At Grafana Labs, open source has always been part of our DNA. But in 2023 — a year in which we reflected on 10 years of Grafana, among other major OSS milestones — the power of our open source community felt especially palpable.
Context isn't just for Christmas
Everyone has their own toys to play with this Christmas, but we all have more fun when we share. The same applies to the tools we use, the data we collect, and the insights we act on. In this video, I'll show you how one of our valued (and definitely real) customers “North Pole Industries” utilizes SquaredUp to share the magic of observability.


