Dashboard Fridays: Home Solar Power Monitoring dashboard
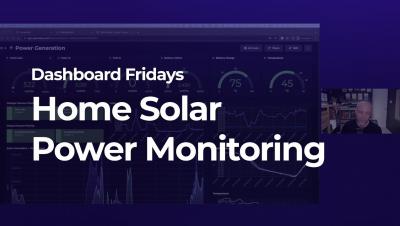
In our latest Dashboard Fridays episode, Adam Kinniburgh showcases his Home Solar Power Monitoring dashboard built using SquaredUp and Amazon Timestream. This dashboard tracks the home energy system, which is monitored using Solar Assistant running on a Raspberry Pi in Adams garage. It shows how much solar power is being generated, how much energy is stored in the batteries, how much energy he's using, plus other metrics.