Grafana 8.0: Unified Grafana and Prometheus alerts, live streaming, new visualizations, and more!
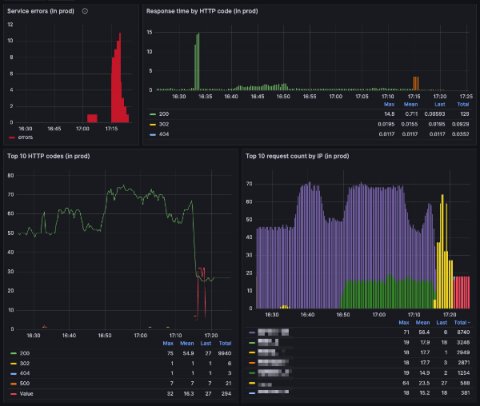
Another GrafanaCON(line), another major release! And as I shared in the opening keynote today, Grafana 8.0 is the biggest, baddest release yet!
In addition to all the great talks from community members about their use cases, GrafanaCONline 2021 will include a number of sessions with the Grafana team about the latest features and use cases for Grafana. Throughout the week, we’ll continue to unveil new features, go deeper with live demos, and share our plans about the future of Grafana.
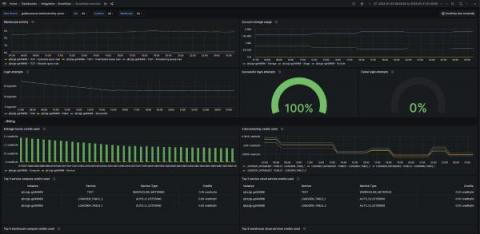
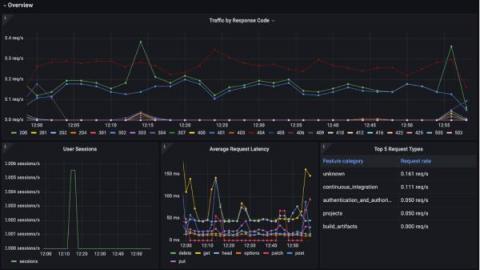
We are happy to announce that the NGINX integration is available for Grafana Cloud, our composable observability platform bringing together metrics, logs, and traces with Grafana.
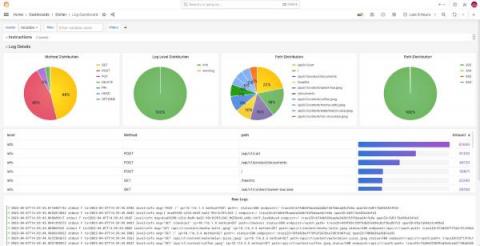
If you’ve checked out SquaredUp for SCOM/Azure and decided for one reason or another that it wasn’t the right tool for you, you are in for a treat! Our latest free tool, Dashboard Server, addresses many of the same pain points, but this time, for a variety of platforms not tied to SCOM or Azure. On the flip side, if you’re currently using SquaredUp for SCOM/Azure, don’t click away!
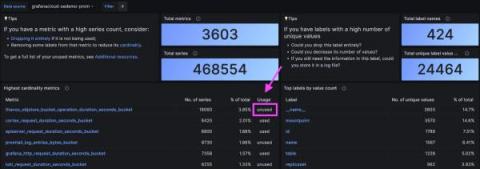
Being able to get the big picture and immediately pivot between siloed data is one of the key values Grafana Cloud provides. Our composable observability platform integrates Prometheus and Graphite metrics, Loki logs, and Tempo traces with Grafana — and also allows you to draw data in from other sources of your choice concurrently.
Every enterprise has its arsenal of tech tools to tackle an array of different challenges. If you’re using SquaredUp for SCOM, you already have the best dashboard for SCOM data – but what if you could track all the metrics from all your tools on a single dashboard? Typically, to get the full picture of your infrastructure, you need the right toolset to connect to Web API, a SQL database, or through other means.
I recently got a couple of Philips Hue Play lights to spice up my home office setup, and after a bit of tinkering with the APIs, I decided it would be a fun project to create my own personal NOC room, using them to visualize the status of some system I’m monitoring.